Nitrogen+Syngas 402 Jul-Aug 2026
Blue ammonia competing in emerging markets


BLUE AMMONIA

Blue ammonia competing in emerging markets

The ammonia industry is undergoing a structural shift, with carbon intensity becoming a key competitive factor alongside feedstock cost, plant scale, and operating reliability. VK Arora of Kinetics Process Improvements (KPI) compares the delivered-cost competitiveness of blue ammonia from regions including the US Gulf Coast, Western Canada, Atlantic Canada, the Middle East, Indonesia, and Malaysia into Japan, the European Union, and South Korea.

Ammonia competitiveness has traditionally been defined by feedstock cost, plant scale, and operating reliability. This framework is shifting as carbon intensity (CI) becomes a prerequisite for market access.

The analysis in this article focuses on new-build low-carbon ammonia plants using autothermal reforming (ATR) / partial oxidation (POx) with pre-combustion carbon capture and storage (PCCS). It shows that competitiveness depends on a combination of feedstock cost, power carbon intensity, carbon capture integration, infrastructure readiness, and shipping logistics.

North America is a major ammonia-producing region with competitive gas costs and established infrastructure. Canada has advanced several blue ammonia projects and export terminal developments that could expand its role by the early 2030s, subject to development of CO2 transport and sequestration infrastructure. East Asia, particularly Indonesia and Malaysia, represents the incumbent Pacific Basin supply base, supported by existing production, export infrastructure, and proximity to Japan (~2,500 to 3,500 nm), resulting in structurally lower freight cost and delivery risk. Their competitiveness depends on transitioning existing assets toward low-carbon configurations.

The Middle East remains the lowest-cost ammonia-producing region, but its outlook is evolving as carbon capture and storage (CCS) infrastructure develops and logistics risks, including Strait of Hormuz transit, persist. Current exporters such as Trinidad and Tobago, Algeria, Egypt, Russia, Indonesia, Malaysia, and Oman continue to define global trade flows but face increasing exposure to carbon-related costs.

The central question confronting producers is no longer whether to decarbonise, but how to decarbonise while maintaining delivered cost competitiveness in carbon-constrained markets.

Emerging demand centres

Japan: The anchor market

Japan represents the most structured demand centre for low-carbon ammonia. Japan’s Ministry of Economy, Trade and Industry (METI) framework applies a carbon intensity threshold of ~0.87 t CO2e/t NH3 on a well-to-gate basis (feedstock through plant gate).

This corresponds to a ~60–65% reduction versus grey ammonia (~2.3 t CO2e/t NH3 well-to-gate; ~1.8 t CO2/t NH3 at plant level) and is expected to tighten as certification frameworks evolve.

Japan provides up to 15 years of price-gap support, backed by ~¥20 trillion (~$130–140 billion) of GX Economic Transition Bonds, repaid through future carbon pricing revenues. This structure enables long-term offtake.

METI’s first Contracts for Difference (CfD) awards (2025) include JERA and Mitsui importing ~0.7–0.8 million t/a from the Blue Point project (Louisiana), with start-up targeted around 2029. Japan is currently the only market where low-carbon ammonia offtake is bankable at scale.

European Union: CBAM as a trade mechanism

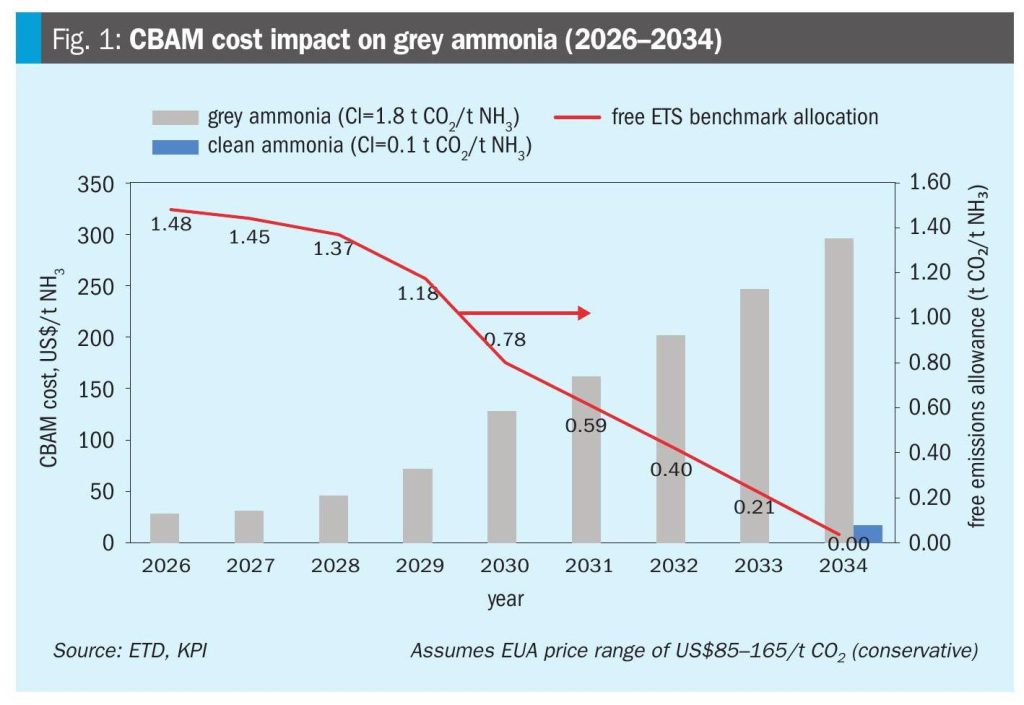
The EU’s Carbon Border Adjustment Mechanism (CBAM) imposes escalating carbon costs on imports exceeding benchmark emission levels. Based on a European Union Allowances (EUA) price range of $85 to $165/t CO2 (2026– 2034), CBAM exposure for unabated grey ammonia increases from approximately $25–30/t NH3 in 2026 to ~ $280–300/t NH3 by 2034 as free allocations phase out. CBAM accounting applies to embedded production emissions (Scope 1 and 2) and does not currently include Scope 3 emissions such as shipping. At higher EUA levels, this carbon cost becomes a material fraction of delivered ammonia cost.

The EU’s import base is dominated by Algeria, Egypt, Russia, Trinidad and Tobago, and the United States, supplying predominantly grey ammonia at approximately 1.8–2.2 t CO2 /t NH3 (Scope 1+2 basis). This excludes upstream emissions and is consistent with CBAM accounting. As free allocations decline, these incumbents face increasing carbon costs unless emissions are reduced.

Blue ammonia with a carbon intensity in the range of 0.15 to 0.35 t CO2 /t NH3 (Scope 1+2) incurs relatively low CBAM exposure (~$20–60/t NH3 even by 2034), creating a structural competitive advantage. CBAM shifts competitiveness from incumbent grey supply toward low-carbon ammonia over time.

South Korea: Market in transition

South Korea is an uncertain demand centre for low-carbon ammonia. Its Clean Hydrogen Portfolio Standard (CHPS) was intended to support hydrogen-based power, but the cancellation of the 2025 tender has introduced policy uncertainty.

Ammonia demand depends on its competitiveness as a hydrogen carrier, given cracking losses of 15–25% and competition from LNG and direct hydrogen pathways. Unlike Japan, long-term offtake structures are not yet established.

South Korea therefore represents a potential but not yet bankable demand market, dependent on policy clarity and fuel economics.

Regional competitive position

Feedstock cost and power carbon intensity

North America holds a feedstock advantage at $2.0–4.0/million Btu, while Middle Eastern producers retain the lowest costs at $0.5–2.0/million Btu. East Asian suppliers (Indonesia, Malaysia) fall in the $4.0–8.0/ million Btu range, reflecting domestic pricing and LNG opportunity costs. Europe ($10–16/ million Btu) and Japan/Korea ($14–20/million Btu) remain structurally disadvantaged.

For oxygen-based configurations, power carbon intensity is a critical determinant of competitiveness. W.Canada’s BC Hydro grid (80–160 kg CO2 /MWh) is significantly cleaner than the US Gulf Coast (340–430). Middle Eastern grids range from 300–520, with the UAE benefiting from lower effective intensity due to nuclear generation. East Asian grids are the most carbon-intensive – Indonesia ~700–750, Malaysia ~550–600 kg CO2 /MWh – increasing Scope 2 emissions unless supplied with dedicated low-carbon power. Atlantic suppliers such as Trinidad benefit from proximity to Europe but face increasing carbon cost exposure under CBAM.

Feedstock cost defines baseline economics; power carbon intensity determines qualification for low-carbon markets.

North America

The US Gulf Coast is the most execution-ready supply region, supported by established infrastructure, emerging CO2 pipelines, and the 45Q tax credit at $85/t CO2. Western Canada offers lower gas costs, a cleaner grid, strong storage potential, and the shortest Pacific route to Japan (~4,800 nm, ~14 days), compared to ~9,500 nm (~28 days) from the USGC via Panama, avoiding canal fees and constraints.

Nova Scotia provides the shortest Atlantic route to Europe (~3,200 nm, ~10 days). Canada’s advantage is structural, but market capture depends on converting projects into bankable export capacity.

Caribbean: Trinidad and Tobago

Trinidad and Tobago is an established ammonia exporter to Europe, supported by gas-based production and established export infrastructure. Its competitiveness is driven by sunk assets and proximity to Atlantic markets, with shipping distances to Europe comparable to North Africa (~4,000–5,000 nm).

However, relatively high gas costs and carbon intensity (~1.8–2.2 t CO2/t NH3, Scope 1+2) limit its position under CBAM without CCS integration. Trinidad remains competitive in the near term as an incumbent supplier, but faces increasing carbon cost exposure relative to low-CI supply.

Middle East

The Middle East remains the lowest-cost ammonia-producing region. CCS deployment is progressing but remains limited: Al Reyadah (~0.8 million t/a), Habshan (1.5 million t/a at FID), QAFCO 7 (1.2 million t/a under construction), and Saudi Arabia’s Jubail hub (targeting up to 9 million t/a by ~2028). Grid carbon intensity (300–520 kg CO2/MWh) partially offsets feedstock advantages. Logistics risk persists due to Strait of Hormuz transit.

North Africa: Algeria and Egypt

Algeria and Egypt are established ammonia exporters to Europe, supported by gas-based production, existing infrastructure, and short Mediterranean shipping distances (~500–3,000 nm), providing a freight advantage.

For Japan, both face a distance disadvantage (~9,000–11,000 nm via Suez), increasing delivered cost and emissions relative to Middle Eastern and Pacific suppliers. Grid carbon intensity (450–600 kg CO2/ MWh) and limited CCS deployment constrain low-CI competitiveness. Egypt offers renewable potential; Algeria remains primarily gas-based. Their role is likely to remain EU-focused, with selective participation in Asia.

East Asia: Indonesia and Malaysia

Indonesia and Malaysia form the incumbent Pacific Basin ammonia supply base, with established trade flows into Japan. Their primary advantage is proximity (~2,500– 3,500 nm), resulting in the lowest freight cost and shipping emissions (~0.026 t CO2 /t NH3), with minimal route risk.

The constraint is high grid carbon intensity – Indonesia ~700–750, Malaysia ~550–600 kg CO2/MWh – resulting in the highest Scope 2 emissions unless projects are supplied with dedicated low-carbon power. CCS development remains project-specific. Their geographic advantage is durable, but competitiveness depends on aligning CCS, clean power, and certification with Japan’s demand.

Australia

Australia is a prospective green ammonia supplier to Japan, supported by strong renewable resources and export logistics. Shipping distances (~3,500–5,000 nm) are shorter than the US Gulf Coast and comparable to Southeast Asia.

Most projects remain pre-FID, with competitiveness dependent on declining renewable and electrolyser costs and supporting infrastructure. Australia is a significant long-term supplier but limited in near-term capacity.

Other emerging suppliers

Norway, Chile, and Brazil are developing low-carbon ammonia pathways but are not expected to materially impact near-term export markets. Norway offers advanced CCS integration for European supply, while Chile and Brazil benefit from renewable resources but face distance and infrastructure limits. Their relevance increases as projects mature.

Carbon intensity: Scope 1, 2, and 3

Blue ammonia competitiveness requires consideration of all three emission scopes: Scope 1 (plant emissions), Scope 2 (power), and Scope 3 (logistics and upstream).

For new-build ATR + PCCS configurations, Scope 1 emissions are low (~0.04– 0.06 t CO2/t NH3) and broadly similar across regions, reflecting high pre-combustion capture and minimal residual combustion.

Scope 2 emissions vary significantly by region, driven by grid carbon intensity, ranging from ~0.06 t CO2/t NH3 (Western Canada, BC Hydro) to ~0.30–0.35 (Indonesia). This is the primary source of variation in delivered carbon intensity and a key differentiator across supply regions.

Scope 3 emissions (shipping and handling) favour geographically proximate suppliers, reinforcing the advantage of Pacific Basin routes to Japan.

CBAM applies to Scope 1 and 2 emissions only, while delivered carbon intensity for end-use comparisons must include Scope 3. This distinction is critical when comparing policy compliance versus full lifecycle competitiveness.

Shipping and delivered cost

Delivered cost is determined at the receiving terminal, with shipping distance and route as key drivers. Transit times range from ~5–7 days (Indonesia/Malaysia to Japan) to ~28 days (US Gulf Coast via Panama). Freight costs range from ~$25–40/t NH3 for short Pacific routes to $70–120/t NH3 for long-haul shipments. Atlantic suppliers such as Trinidad and North Africa benefit from shorter routes to Europe relative to USGC exports.

Middle Eastern suppliers face additional logistics and insurance risk associated with Strait of Hormuz transit, while US Gulf Coast exports via Panama are subject to canal fees and potential delays. In contrast, East Asian suppliers benefit from the shortest, most direct Pacific routes with minimal transit risk.

Shipping provides a structural cost advantage for Pacific Basin suppliers and a key driver of delivered competitiveness.

Technology configurations

This analysis focuses on new-build low-CI ammonia configurations using ATR/POx with CCS, which provide the most robust basis for export competitiveness. These configurations shift most CO2 into a high-pressure process stream, enabling high pre-combustion capture and lower residual Scope 1 emissions.

ATR + PCCS is the primary reference case as it is closest to bankable blue ammonia deployment. POx + PCCS offers potentially lower residual emissions and compact design, but requires higher oxygen and power input and has more limited ammonia experience. In both cases, Scope 2 emissions become a major differentiator because oxygen production, compression, and utilities increase power demand sensitivity.

Retrofit pathways are relevant for existing grey ammonia assets but are not used as the delivered-cost basis in this article. PCCS captures high-purity process CO2 and is the lowest-cost first step, but it is limited by available process CO2 and typically leaves residual combustion emissions. PCCS alone may reduce CI materially but provides limited margin against tightening export thresholds. Adding post-combustion carbon capture and storage (PoCCS)

can further reduce Scope 1 emissions, but flue-gas capture is more costly and operationally constrained by low CO2 concentration, oxygen-related solvent degradation, and reliability limits at very high capture rates. For this reason, PCCS and PoCCS are best viewed as transitional decarbonisation options for existing plants, not the preferred basis for new export-scale low-CI ammonia.

Table 1 shows technology pathways relevant to low-CI ammonia exports.

Delivered cost framework

Figs 5a–5c show indicative delivered-cost comparisons based on new-build ATR/POx + PCCS configurations. Retrofit options are excluded from the cost curves because their performance is highly site-specific and they may not reliably meet tightening export-market CI thresholds.

Fig. 5a compares delivered low-CI ammonia cost to Japan by supply region. Grey ammonia is excluded as it does not meet Japan’s low-carbon eligibility threshold.

Fig. 5b breaks delivered cost to Japan into variable cost, fixed cost, capital recovery, logistics, and policy support. The results show that capital recovery, power cost, and logistics can outweigh feedstock advantages.

Fig. 5c compares EU delivered cost after CBAM effects. Unlike Japan, grey ammonia is included as an incumbent reference, with CBAM determining how rapidly its cost advantage erodes. By 2034, CBAM exposure materially narrows or eliminates the advantage of grey imports from most origins.

These figures reinforce the central thesis: carbon intensity enables market access, but delivered cost determines competitiveness.

Policy frameworks

While the preceding analysis reflects underlying cost competitiveness, policy frameworks determine how these differences translate into market outcomes.

Policy support for low-carbon ammonia is asymmetric across regions, operating through three distinct mechanisms: supply incentives, demand support, and carbon pricing.

The United States provides direct supply-side support through the 45Q tax credit ($85/t CO2), which improves project economics for blue ammonia. Japan supports demand through long-term CfD contracts (up to 15 years) linked to a defined carbon intensity threshold (~0.87 t CO2 e/t NH3), enabling bankable offtake. The European Union applies carbon pricing through CBAM, increasing the cost of unabated imports over time.

Canada’s Output-Based Pricing System (OBPS) provides indirect value through avoided carbon costs rather than direct subsidies, while South Korea’s CHPS framework remains uncertain. The Middle East and East Asia rely primarily on sovereign investment and developing CCS frameworks rather than explicit carbon pricing or demand support.

No single policy mechanism is sufficient on its own; competitiveness emerges where supply support, demand certainty, and carbon pricing align.

Japan is currently the only market where demand support and carbon thresholds are sufficiently aligned to enable final investment decisions.

Conclusions

Blue ammonia competitiveness is determined by delivered cost rather than carbon intensity alone. Japan remains the anchor market, supported by policy-backed demand and bankable offtake structures. The EU will become increasingly important as CBAM exposure rises, while South Korea remains uncertain.

Regional competitiveness reflects a trade-off between feedstock cost, carbon intensity, and logistics. The Middle East retains a structural feedstock advantage, North America benefits from infrastructure and policy support, and East Asian incumbents hold proximity advantages for Japan but face higher Scope 2 emissions. Western Canada achieves the lowest carbon intensity but requires timely development of export infrastructure. North Africa remains competitive for EU supply but is constrained for Asia by distance and carbon intensity.

New-build ATR/POx configurations with PCCS provide the most robust pathway for export-scale low-carbon ammonia. Retrofit options such as PCCS and PoCCS can reduce emissions from existing assets but are unlikely to meet tightening carbon intensity thresholds for long-term export markets.

No single factor determines competitiveness; delivered cost reflects the combined impact of capital, power, feedstock, carbon management, and logistics. As low-carbon ammonia markets develop, the most competitive suppliers will be those that optimise across all five dimensions.

Carbon intensity enables market access. Delivered cost determines who captures the market.

References

Latest in Decarbonisation