Sulphur 402 Sept-Oct 2022

30 September 2022
Claus catalyst performance at end-of-run conditions
CLAUS CATALYSTS
Claus catalyst performance at end-of-run conditions
Temperature dependent rate constants for the hydrolysis of CS2 and COS across Claus Al2O3 and TiO2 catalysts are valuable tools for the design and optimisation of new, as well as existing, sulphur recovery units. In this context, Alberta Sulphur Research Ltd (ASRL) has measured CS2 and COS hydrolysis rates over a range of temperatures for both Al2O3 and TiO2 catalysts under start-of-run and, more recently, end-of-run first converter conditions. In this article Christopher Lavery, Dao Li, Ruohong Sui, and Robert A. Marriott of ASRL report on their methodology and the utility of the kinetics calculated from their data and draw comparisons between the start-of-run and end-of-run results.
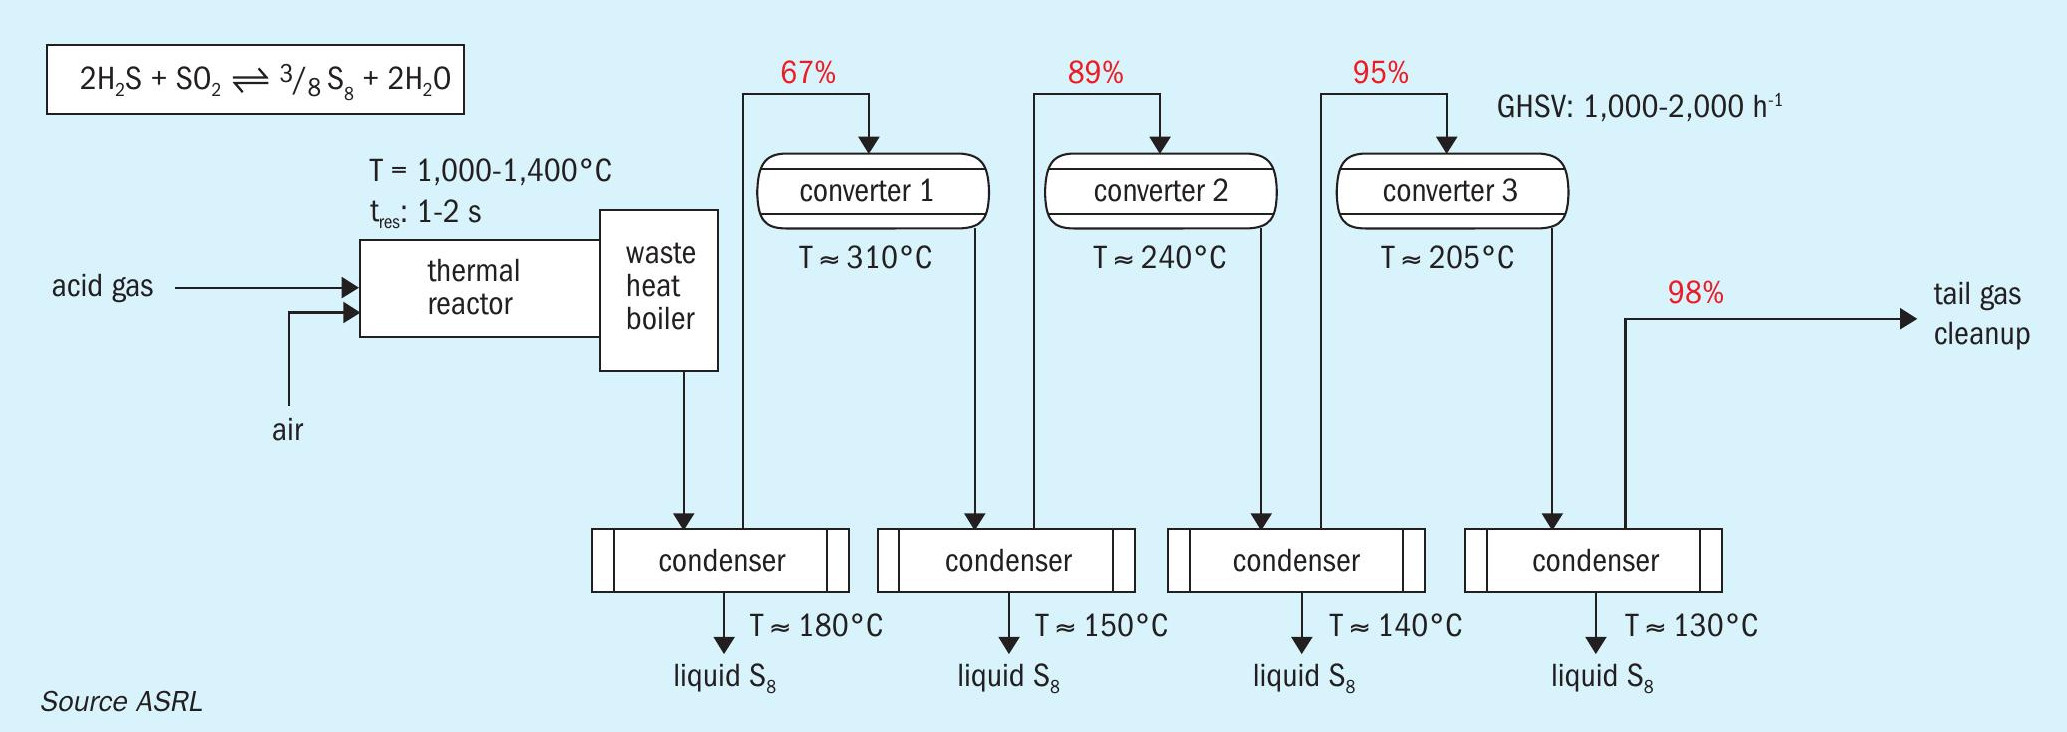
The modified Claus process is an equilibrium limited system whereby hydrogen sulphide is converted to elemental sulphur and water across a thermal reactor and several catalyst beds operated at successively lower temperatures (Fig. 1). A theoretical sulphur recovery of 98% is possible with three catalyst beds; however, sulphur recovery efficiencies of up to >99.9% can be obtained if implemented in combination with the appropriate tail gas cleanup (TGCU) technology. However, such high recoveries require both the thermal and catalytic stages to operate at optimal efficiency. This is complicated by acid gas contamination with impurities such as hydrocarbons (gas plant scenario) and/or ammonia (refinery scenario). Furthermore, the amount of hydrocarbon contamination has a marked influence on concentrations of both carbon disulphide (CS2) and carbonyl sulphide (COS) that form within the thermal reactor and end up reaching the Claus catalyst beds1. At thermal reactor temperatures, CS2 can be formed from direct reaction between hydrocarbons and elemental sulphur as shown in reaction 1. While most COS arises from recombination of CO and sulphur upon cooling of these species in the waste heat boiler (reaction 2), there are a multitude of other interlinked transformations at play that will influence this overall reaction which may also lead to COS formation2 .
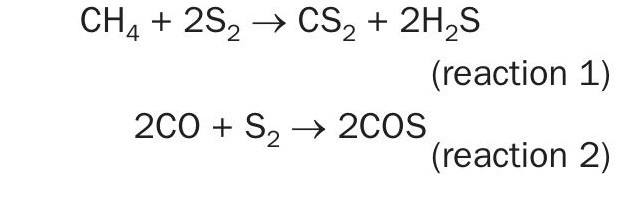
Although some destruction occurs in the thermal reactor, any extraneous CS2 and COS that persist through the thermal reactor and waste heat boiler must be destroyed across the catalytic converters according to reactions 3 and 4, respectively.
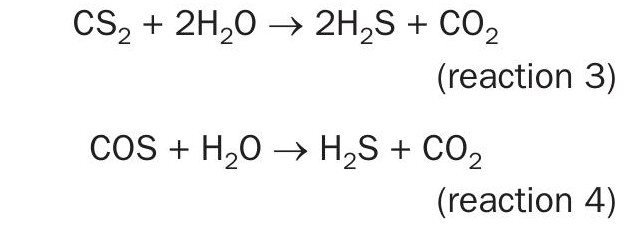
Equilibrium allows for quantitative CS2 destruction and very high COS (>99%) conversions. However, reactions 3 and 4 typically operate in the kinetic regime, i.e., below equilibrium conversion, under industrial Claus conditions. Therefore, the temperature dependent rate constants for the hydrolysis of CS2 and COS across Claus Al2O3 and TiO2 catalysts are valuable tools for the design and optimisation of new, as well as existing, sulphur recovery units. Indeed, in some cases, up to 50% of sulphur recovery losses can be attributed to inefficient CS2 and COS destruction3 .
Materials and methods
For safety reasons, the laboratory equipment discussed below is housed within a ballistic ventilated walk-in bay containing H2S and SO2 detectors which shut off air operated supply gas valves when in high-alarm (≥10 ppm).
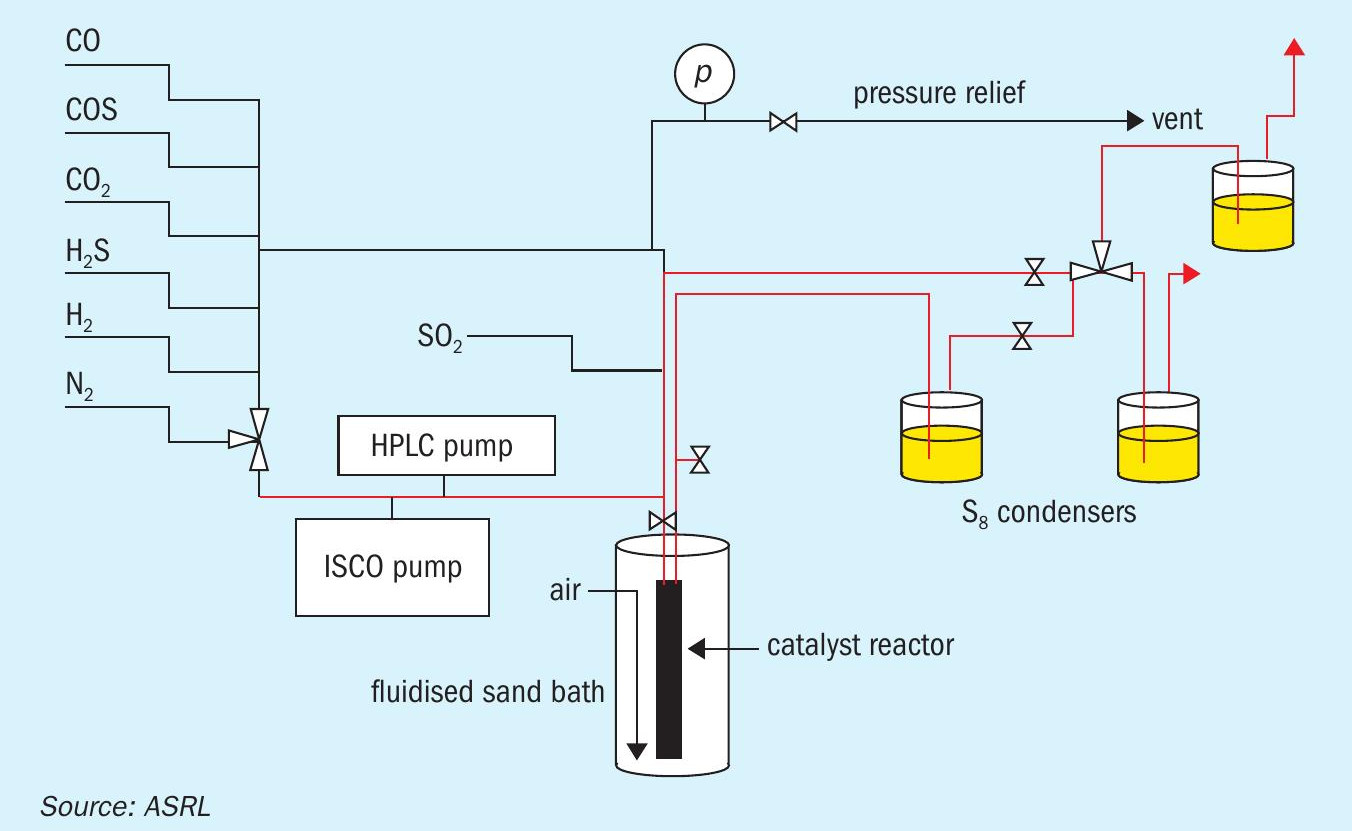
All experiments were executed in a vertical stainless steel fixed-bed reactor with a 2.5 cm o.d. × 39.4 cm length and an i.d. of 2.1 cm that has been described previously and is shown schematically in Fig. 24. In short, the reactor temperature was controlled isothermally (± 1°C) over its full length by means of an air-ebullated sand bath. Isothermal control was confirmed by a series of six axially located thermocouples (not shown in the schematic). Any elemental sulphur formed during experimental runs was removed by condensation with in-line sulphur traps (T ª 50°C).
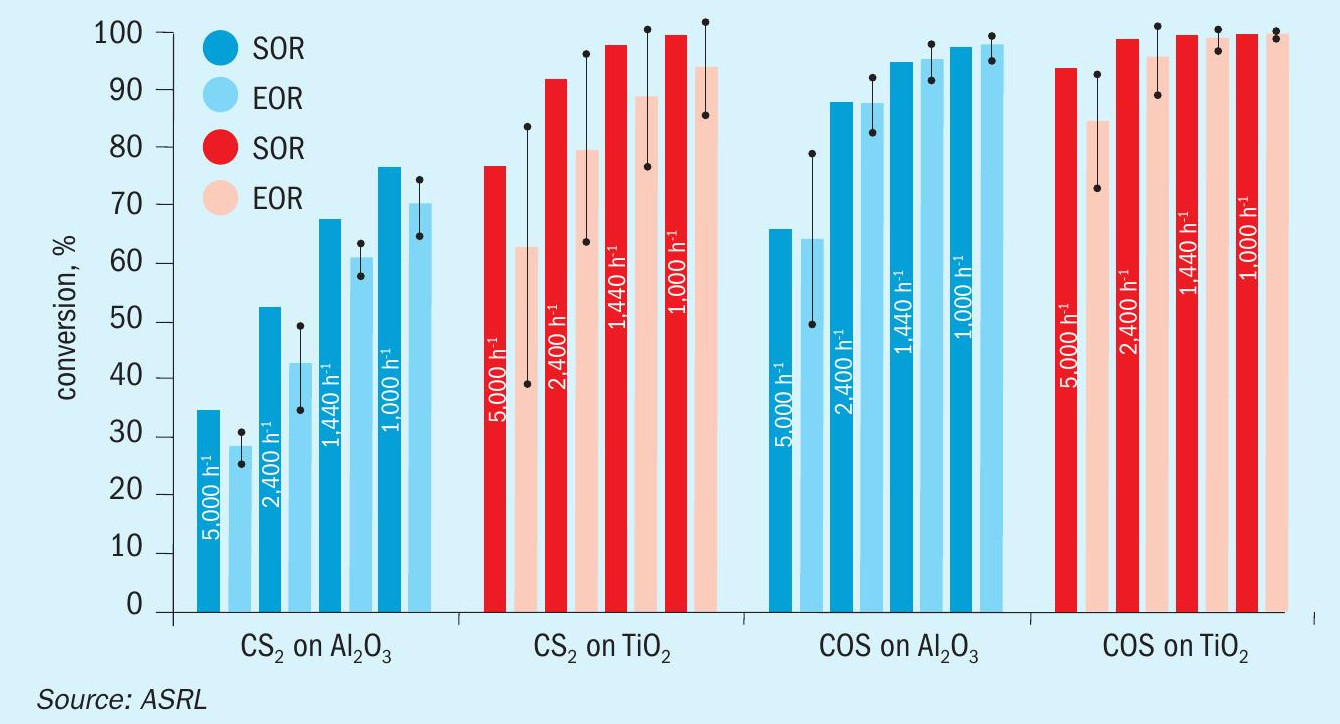
For each of the experiments, the stainless-steel reactor was charged with either 25 mL of Claus Al2O3 or TiO2 catalyst. A suite of experiments consisted of measuring CS2 and COS hydrolysis at 330, 300 and 260°C, with total flow rates corresponding to gas hourly space velocities (GHSVs) of 5,000, 2,400, 1,440 and 1,000 h-1 (Tref = 25°C and pref = 1 atm). These GHSVs corresponded to actual catalyst contact times of i) 0.35, 0.73, 1.25 and 1.75 s at 330°C; ii) 0.36, 0.77, 1.31 and 1.84 s at 300°C; and iii) 0.40, 0.82, 1.41 and 1.98 s at 260°C. The composition of the representative first converter feed employed was 58.1 % N2, 7.9 % H2 S, 4.0 % SO2, 30 % H2O and either 0.1% CS2 or 0.1 % COS. By measuring CS2 and COS conversion under each set of experimental conditions described above, the corresponding pseudo-first order plots were prepared.
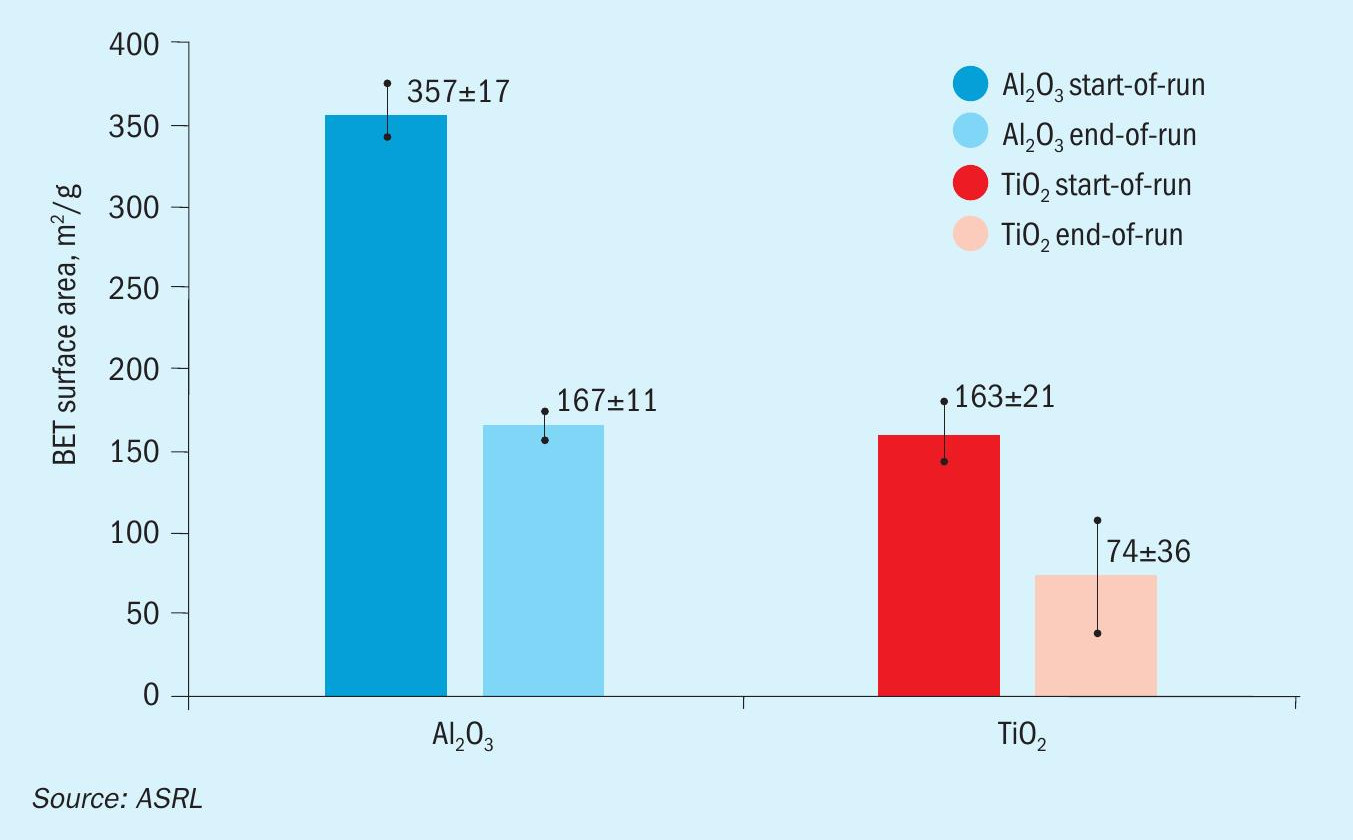
Prior to performing any experiments, the fresh Al2O3 or TiO2 was pre-sulphated at 320°C by flowing a feed consisting of 58.0 % N2, 8.0 % H2S, 4.0 % SO2 , and 30.0 % H2O for eight hours (GHSV = 1000 h-1 ). In the start-of-run experiments, this was followed by a 16-hour hydrothermal ageing process at the same temperature and GHSV but with a feed containing 71.5 % N2 , 9.5 % CO2 and 19 % H2O. To simulate end-of-run conditions, the hydrothermal ageing temperature was increased to 500°C. On average, this higher temperature resulted in a ca. 50% surface area reduction compared to the fresh material (Fig. 3).
Using CS2 as an example, conversions were calculated according to equation 1,
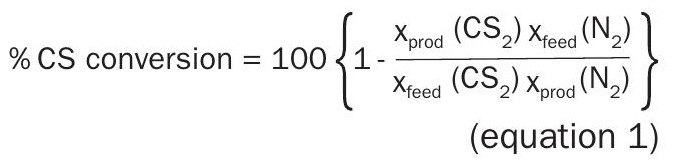
where xfeed and xprod. are the mole fractions in the feed and product streams respectively. This approach uses the inert N2 as an internal standard, to correct for molar changes in the product stream due to either reaction or intentional removal of condensable products (sulphur and H2O).
Results and discussion
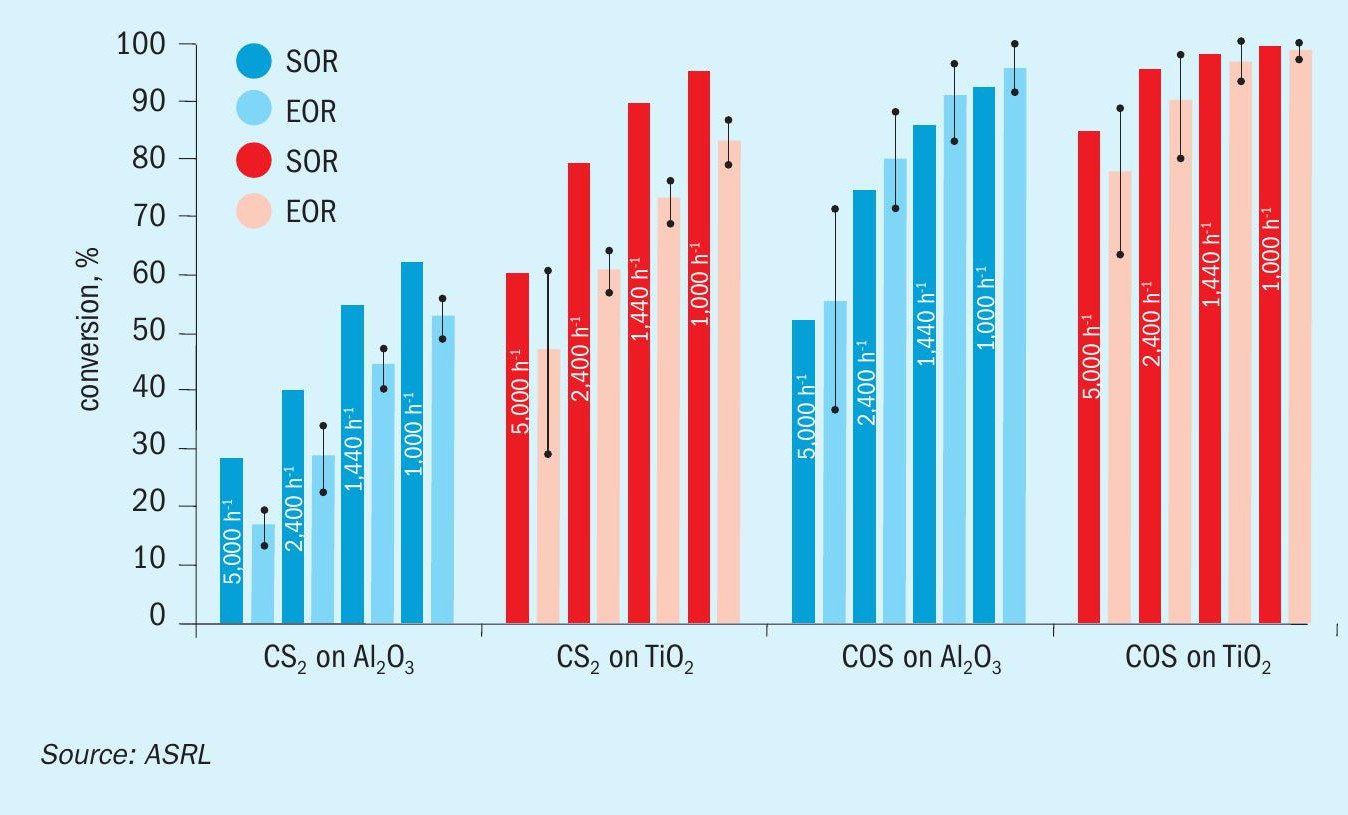
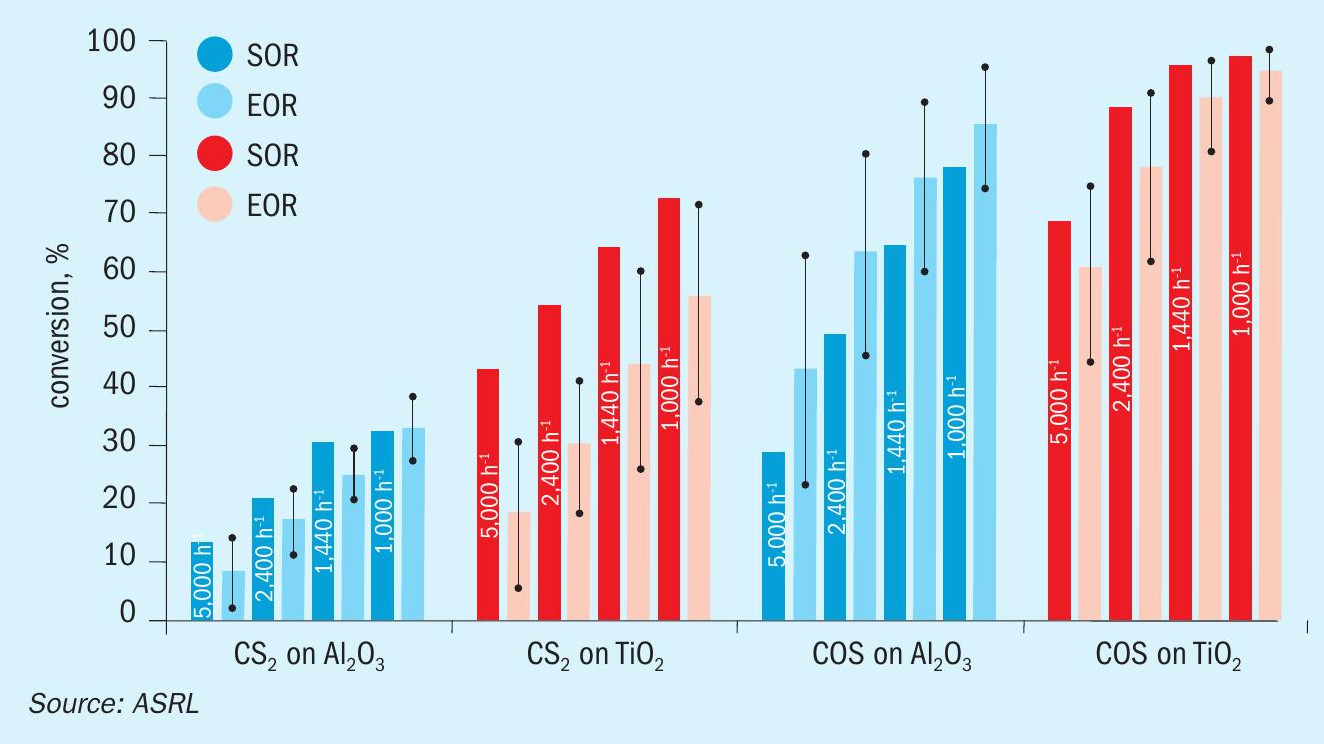
A comparison of previously acquired CS2 and COS conversion data, under startof-run conditions, to the more recently obtained end-of-run data is presented across Figs 4-6. While only one Al2O3 and one TiO2 material were assessed in the start-of-run experiments, several different commercially available samples of each were tested in the end-of-run studies. As such, the end-of-run conversions displayed in Figs 4-6 are an average of the performances, with the associated standard deviation (shown by the error bars), offered by the full range materials. As can be seen, in all instances TiO2 provided superior performance compared to Al2O3 and, under analogous conditions, COS conversion levels were higher than those for CS2. As expected, conversion levels for both CS2 and COS decreased with increasing GHSV and decreasing temperature. This is typical behaviour for reactions operating in a chemically limited regime. In some instances, particularly for COS conversion across Al2O3 , the average end-of-run of conversions were higher than the corresponding start-of-run conversions. This is simply because some of the new catalysts included in our end-of-run studies offered better conversions than the one material that was selected for use in our initial start-of-run tests. However, if each individual material were tested under start-of-run conditions, the conversions would be higher than the corresponding end-of-run conversions. The differences in performances between the various commercial materials that were tested was most noticeable under the more stringent test conditions (i.e., in the high GHSV and low temperature experiments).
With the above data in hand, ASRL first prepared the pseudo-first order plots for CS2 and COS conversion over Al2O3 (Figs 7 and 8) and then used the least square fit rate constants to fit the corresponding Arrhenius plots (Fig. 9). Where the start-of-run data has been reported previously2, only the end-ofrun plots are presented here. On comparison, the conversion of CS2 was impacted more by the end-of-run conditioning than the reaction of COS. For CS2 there was in fact a small decrease in activation energy (slope in Fig. 9; 57.0 ± 3.7 for start-of-run to 44.3 ± 1.4 kJ·mol-1 for end-of-run). Interestingly, the end-of-run activation energy for CS2 conversion across alumina is actually in better agreement with the only other value available in the open literature5 of 40.4 kJ·mol-1. As alluded to above, owing to the broader selection of catalysts included in these end-of-run experiments, the corresponding COS end-of-run rate constants were modestly higher than in the analogous start-of-run tests. However, upon completing the full kinetic workup, the activation energies were quite similar (33.4 ± 0.4 versus 36.3 ± 0.5 kJ·mol-1). For reference, an activation energy of 25.3 kJ·mol-1 has been reported for COS conversion across Al2O3 where the only feed components were COS and H2O6.
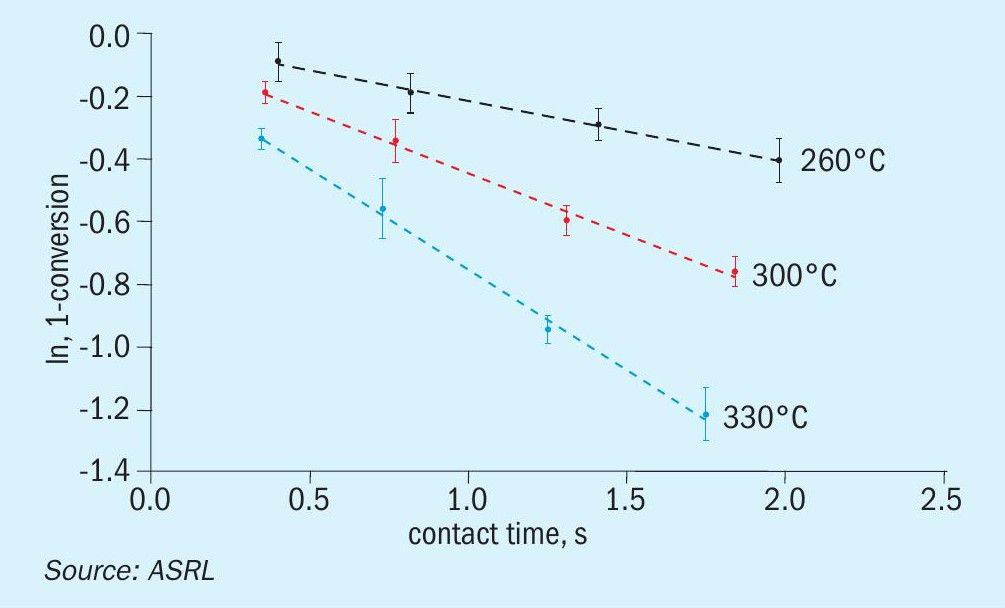
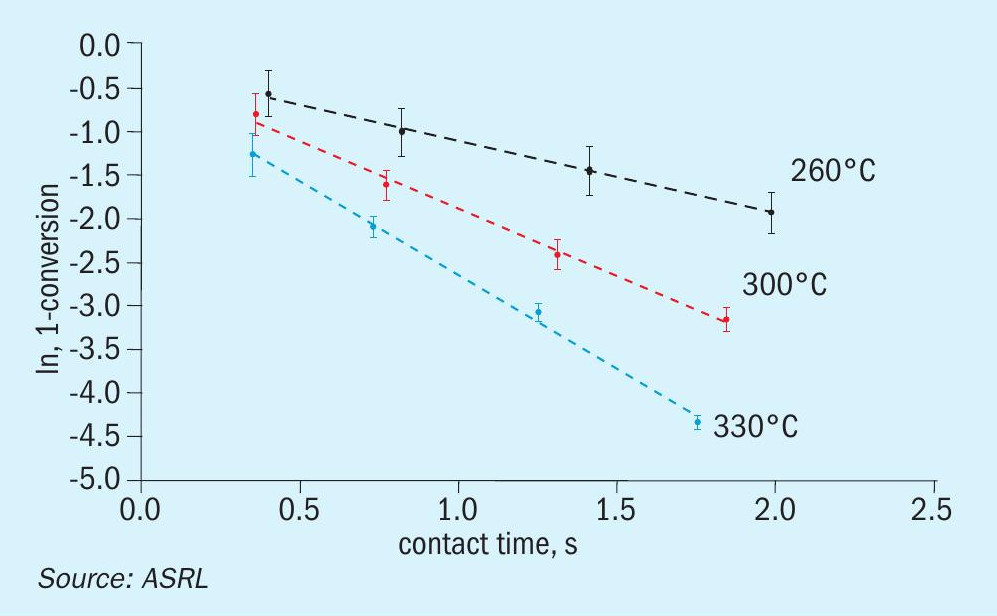
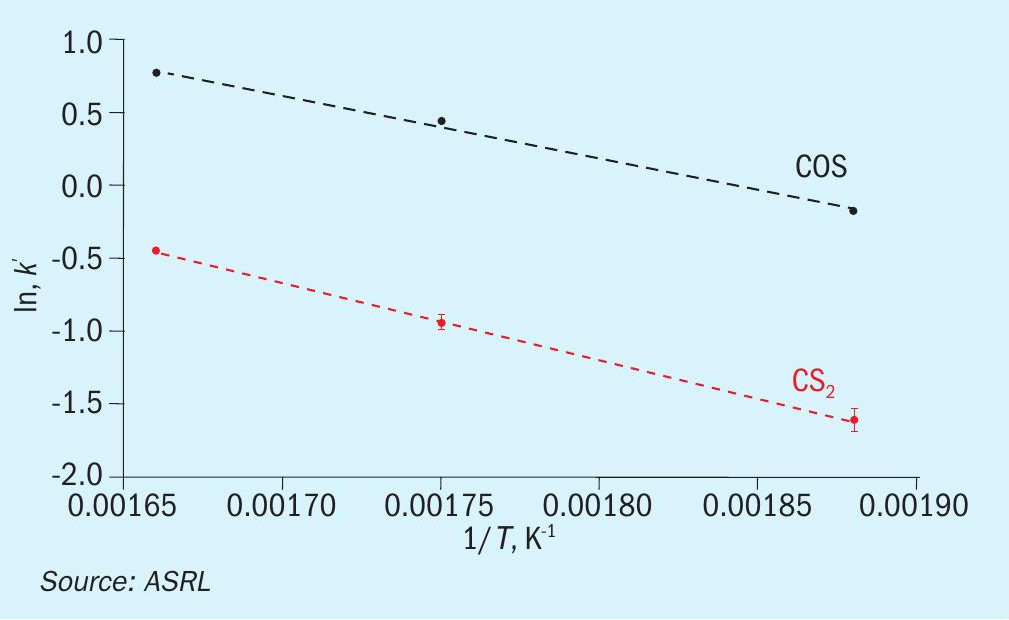
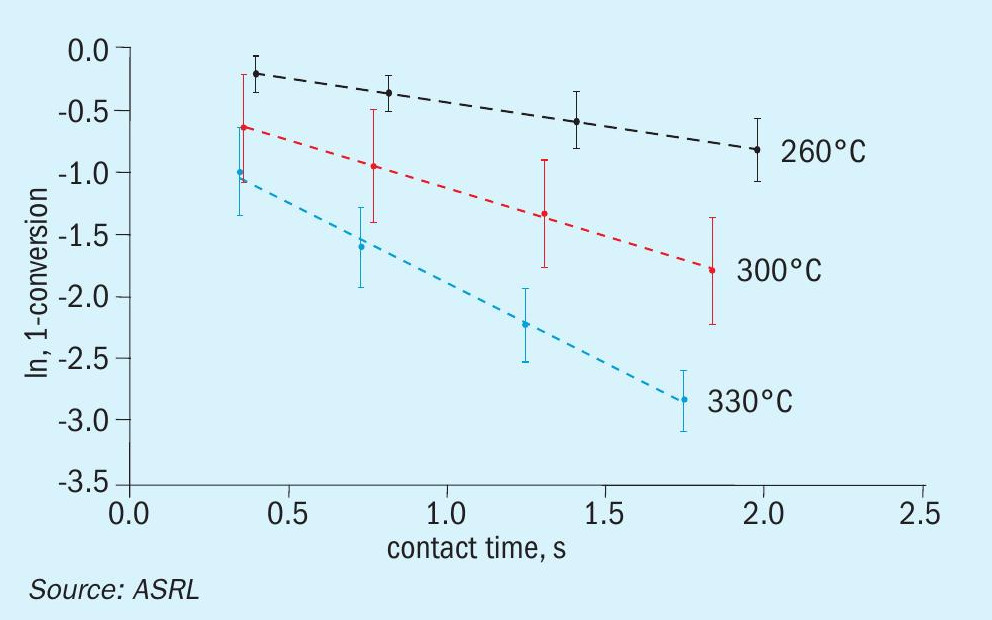
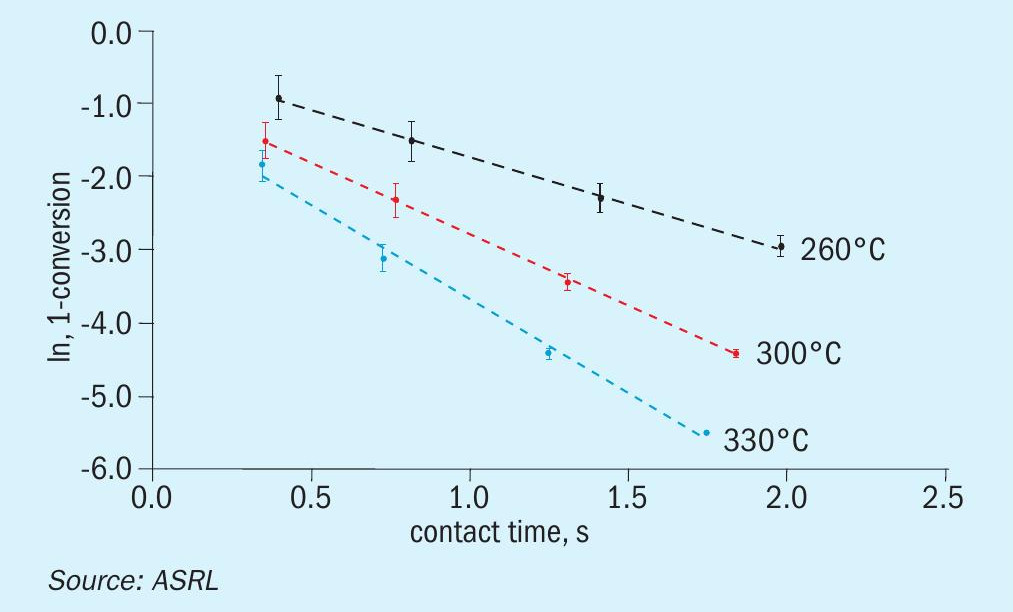
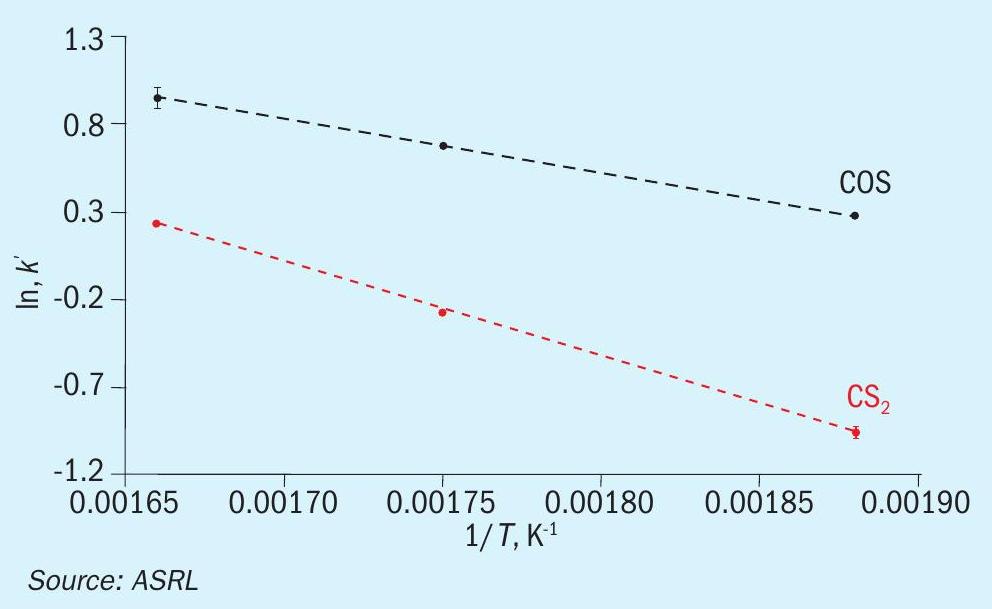
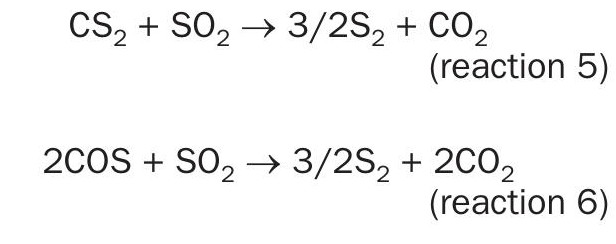
In the same format as above, the pseudo-first order plots for CS2 and COS conversion over TiO2 are presented in Figs 10 and 11, and the matching Arrhenius plots are provided in Fig. 12. As was observed for CS2 over Al2O3 , the end-of-run activation energy activity for CS2 conversion across TiO2 was determined to be lower compared to the analogous start-of-run value (64.6± 5.8 kJ·mol-1 for start-of-run to 45.1 ± 2.0 kJ·mol-1 for end-of-run). While experimental error cannot be ruled out, a significant change in activation energy may be indicative of a different conversion mechanism becoming more prevalent. Indeed, in addition to the hydrolysis reaction, CS2 and COS reaction with SO2, according to reactions 5 and 6, has been shown to be a plausible pathway for conversion across TiO2 under Claus conditions7. However, more studies are necessary to probe if these reactions contribute significantly to overall conversions.
The conversion of COS across TiO2 was approaching equilibrium in the previous start-of-run experiments, with measurements at T = 330°C / GHSV = 1000 h-1 (contact time = 1.75 s) reaching >99.5%. This approach to equilibrium caused a decreased sensitivity in temperature dependence. As such, all three start-ofrun rate constants for this reaction were in statistical agreement, despite the different temperatures. To find a statistically significant activation energy under start-of-run conditions would require lowering the temperature below the dew point or increasing the GHSV beyond what is practical for our system. However, under end-of-run conditions, the conversions were far enough removed from equilibrium that we did observe a statistical difference in our rate constants, thereby allowing us to define an activation energy of 25.7 ± 0.2 kJ·mol-1. An activation energy of 41.8 kJ·mol-1 has been reported for COS hydrolysis on TiO2 elsewhere6.
Note that the start-of-run activation energy for CS2 conversion across Al2O3 (57.0 ± 3.7 kJ·mol-1 ) is lower than that for CS2 across TiO2 (64.6 ± 5.8 kJ·mol-1 ). Additionally, the end-of-run activation energies for CS2 conversion across Al2O3 and TiO2 are within experimental error of one another (44.2 ± 1.4 kJ·mol-1 and 45.1 ± 2.0 kJ·mol-1 ). This may seem unexpected at first glance, provided the higher activity of TiO2 for CS2 and COS conversion compared to Al2O3 under analogous Claus conditions. However, it has been shown that while employing a feed containing just H2O and CS2 or H2O and COS, Al2O3 actually outperforms TiO2 in the corresponding hydrolysis reactions9 . It is only when the full effects are realised under Claus conditions that TiO2 becomes more active than Al2O3. There is good evidence to support that this is related to a higher surface concentration of sulphate species that is established on Al2O3 under Claus conditions, which in-turn reduces access to catalyst active sites4,8 . Indeed, reduction of sulphate by H2S is more facile on TiO2 than Al2O3 at temperatures employed in Claus catalyst beds. Therefore, the higher CS2 and COS conversions across TiO2 can likely be attributed to improved accessibility to catalyst active sites. This would result in a higher turnover frequency that is reflected in the higher pre-exponential factors for TiO2. The authors are mindful that some surface sulphate is unavoidable under Claus conditions as it is in equilibrium with a necessary thiosulphate intermediate.
The first catalyst bed in the modified Claus process is often a split bed containing both Al2O3 and TiO2 to help maximise CS2 and COS conversion. While a full bed of TiO2 would indeed offer higher conversions, cost and susceptibility to fouling from hydrocarbon contamination and/ or sooting issues must be considered10 . Although pure TiO2 beds are not unheard of, Al2O3 is often packed on top of TiO2 as a “guard” layer when a split bed is employed. In this context, the kinetic parameters reported here can also be applied to a split bed; provided the relative proportions are known and the GHSV for each portion of the bed can be determined.
Conclusions and future work
A kinetic study was performed on several commercial high-performance Claus Al2 O3 and TiO2 catalysts under end-of-run conditions and the results were compared to those from ASRL’s previously published start-of-run kinetic study. Except for the COS reaction across Al2O3 , the average end-of-run conversions were generally lower than the start-of-run conversions and this was reflected in the obtained rate constants and kinetic parameters. There was generally more variation in performance between the different Al2 O3 samples compared to the various TiO2 materials that were tested. However, these differences in performance were most evident under the more stringent test conditions. At the lower and more typical GHSVs that would be applied in the field, the differences in performance were less noticeable. Finally, as mentioned above, the Al2O3 samples employed in this study were high-performance activated materials. As such, the kinetic parameters determined here will likely afford conservative approximations for promoted Al2O3 materials. A full publication of the kinetic parameters discussed above can be found in a recent ASRL quarterly bulletin11 .
References