Fertilizer International 527 Jul-Aug 2025

7 July 2025
Resilient demand versus historically bad affordability
GLOBAL FERTILIZER DEMAND
Resilient demand versus historically bad affordability
Affordability has rightly been a huge talking point over the past year. Yet CRU still expects overall global fertilizer demand to remain resilient in 2026, as the impacts of poor affordability should be largely isolated to regional markets such as the US. In this CRU Insight, Anthony Rizzo highlights regional variations and explains why market participants should expect an uneven global demand picture in 2026.
Introduction
Fertilizer demand has remained strong in 2025, despite uncertainty in global markets, with global N, P & K consumption collectively set to reach 211 million nutrient tonnes this year, a 1.9% year-on-year rise, this being driven by a higher agricultural growing area and greater fertilizer applications. While demand has held up this year, fertilizer affordability metrics have recently hit historically bad levels, bringing 2026 demand into question.
There is no need for market participants to panic, though, in CRU’s view. Overall, global N, P and K consumption is expected to remain resilient in 2026, rising another 1% to 213.5 million nutrient tonnes. Regional consumption in key demand markets will be patchy, however, with Brazilian demand moving higher – in step with the global trend – while the US and China are both set to see their domestic demand contract next year.
Global affordability worst since 2022
Fertilizer and crop prices have diverged over the past 12 months, with fertilizers moving higher and crops moving lower, the upshot being a steady deterioration in fertilizer affordability. CRU’s Affordability Indicator has deteriorated by 35-points compared to one year ago, with the fertilizer price indicator 22 points higher and the crop price indicator 18 points lower.
The fertilizer price indicator currently sits at 128 – a level that has been reached only three times before, in 2008-09, 2011-12, and 2021-23. Even worse for affordability, the crop price indicator had an average value of 147 during those previous periods of elevated fertilizer pricing, compared to its current value of 108.
Historically, the only time fertilizer prices were this high, and crop prices conversely this low, was from late 2008 to early 2009. As a result, the CRU Affordability Indicator currently (mid-June 2025) is at 119, a level that has only been seen before in the global financial crisis of 2008/09 and in 2021/22 before and after the start of the Russia-Ukraine conflict.
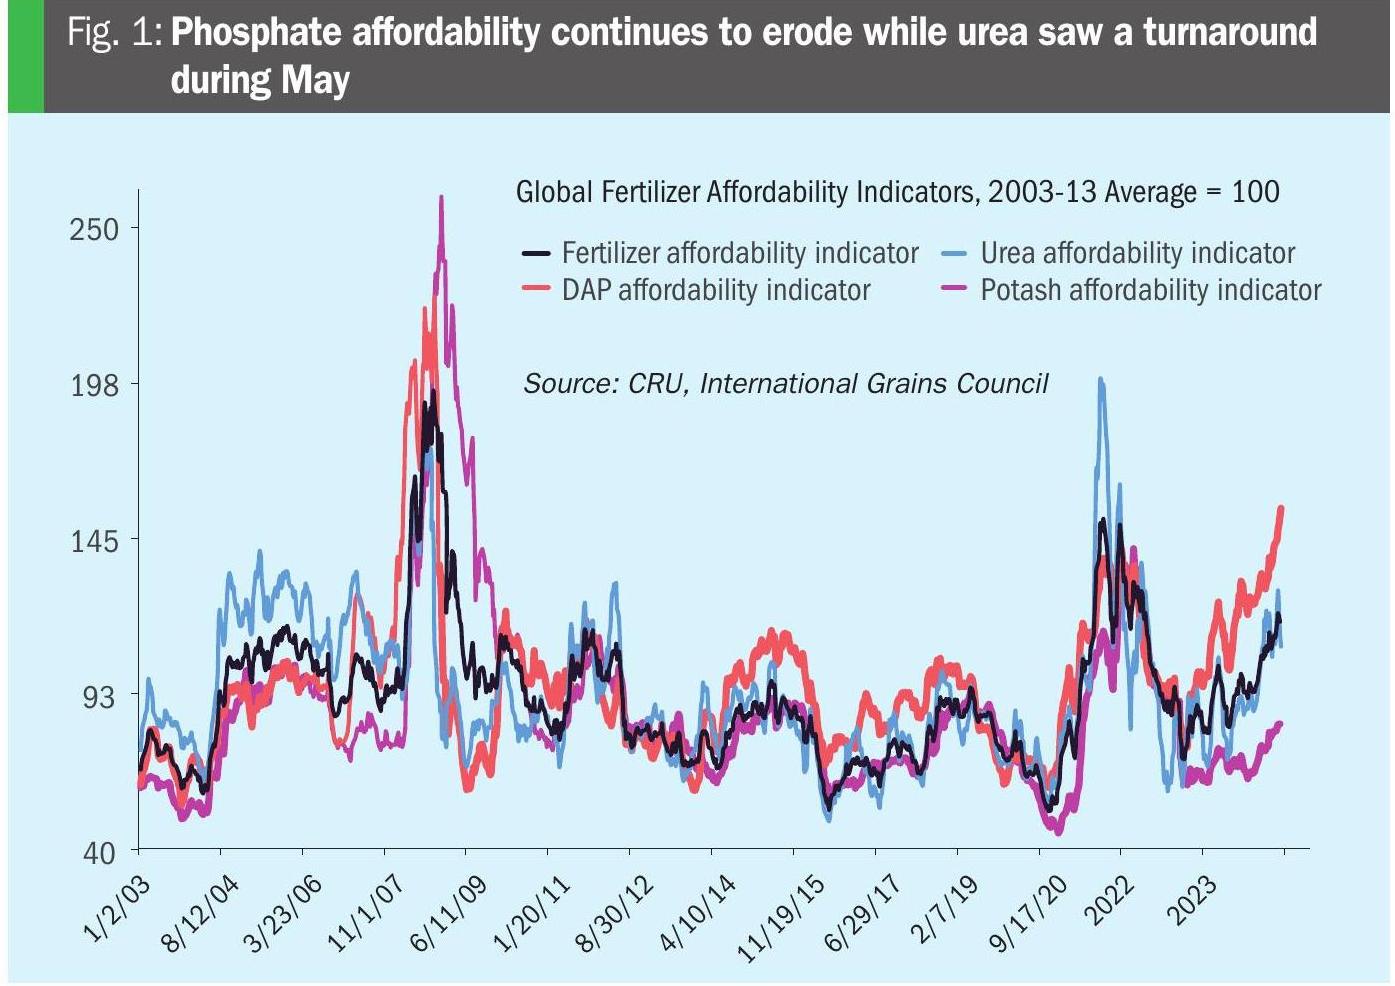
Stark affordability differences between major commodities and nutrients are also notable (Figure 1). The phosphate affordability indicator now sits at 155, for example, the highest level since November 2008. Phosphate prices are back to 2022 levels, while crop prices have fallen significantly since then, worsening affordability. Urea affordability, meanwhile, hit its worst point since late 2022 in early May but has since improved, returning to levels last seen at the start of this year following a recent price reset. While potash affordability is at its lowest level since mid-2023, with prices at their highest since late-2023, the indicator remains comfortably below its cycle average.
Grains trending lower, offering little support for 2026
Grain prices are far removed from their 2022 peaks currently (Figure 2). This is important as crop prices are a key factor in the decision-making process for planting and therefore fertilizer buying. Corn prices, in particular, have cooled off in recent months, after a strong upward movement at the end of 2024 and the start of 2025, and now face multiple factors that could continue to push prices lower. Numerous negative price influences – a historically large US crop, another strong year of production from South America, and expectations of an inventory build in the US – are expected to take their toll during the remainder of 2025.
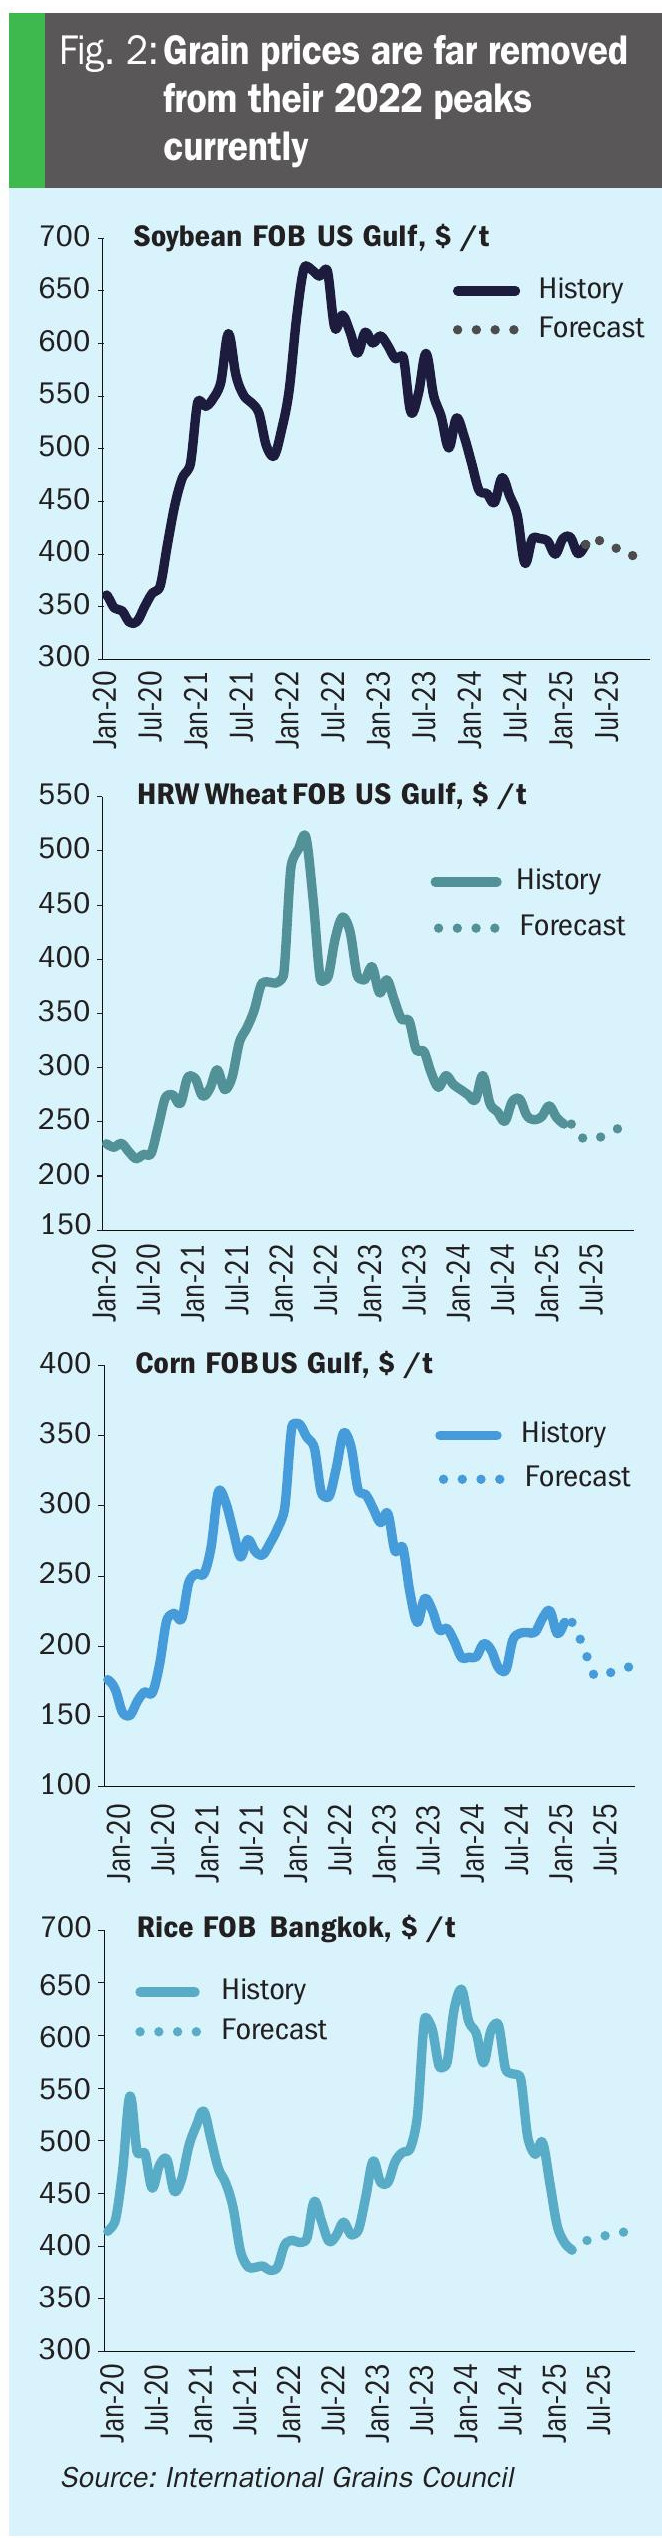
Soybean prices, in contrast, are set for a more modest decline, pressured by South American production, especially Brazil’s record output. While the US soy crop is expected to be lower in 2025, its impact on pricing going forward will be less, as major customer China has taken a large majority of its business to South America where its ‘Belt and Road’ initiative continues to make strides.
Historic corn crop boosts 2025 US demand
US fertilizer demand from 2025 crops has been strong, with nutrient consumption forecast to grow by 2.6% to 20.6 million tonnes. While total harvested acreage is forecast to decline 1.2% this year, a strong increase in the acreage of nutrient hungry corn should offset the declines expected for other grains and oilseeds. USDA’s Prospective Plantings report sees corn acreage of 95.3 million acres this year, up from 90.5 million acres last year. CRU forecasts US 2025 corn acreage slightly lower than USDA at 94 million acres, leaving room for further upside this year, if acreage turns out to be closer to or above USDA’s forecast.
US application rates are all forecast to grow in 2025, due to strong fall and spring applications in anticipation of this historically large corn crop. Nitrogen and potash application rates are each expected to rise by 3 kg/ha, to 119 kg/ha and 51 kg/ha, respectively, while the phosphate application rate is forecast to rise by 2 kg/ha to 39 kg/ha.
Lower 2026 US demand as poor affordability bites
The fertilizer demand outlook for the 2026 US growing season looks increasingly pessimistic, as affordability domestically continues to deteriorate to historically low levels. Going back to 2013, the ratio of the Iowa fertilizer basket price to the corn futures price – a reliable indicator of fertilizer affordability for Midwest growers (Figure 3) – currently ranks second worst for this point in the year, with only 2022 being higher.
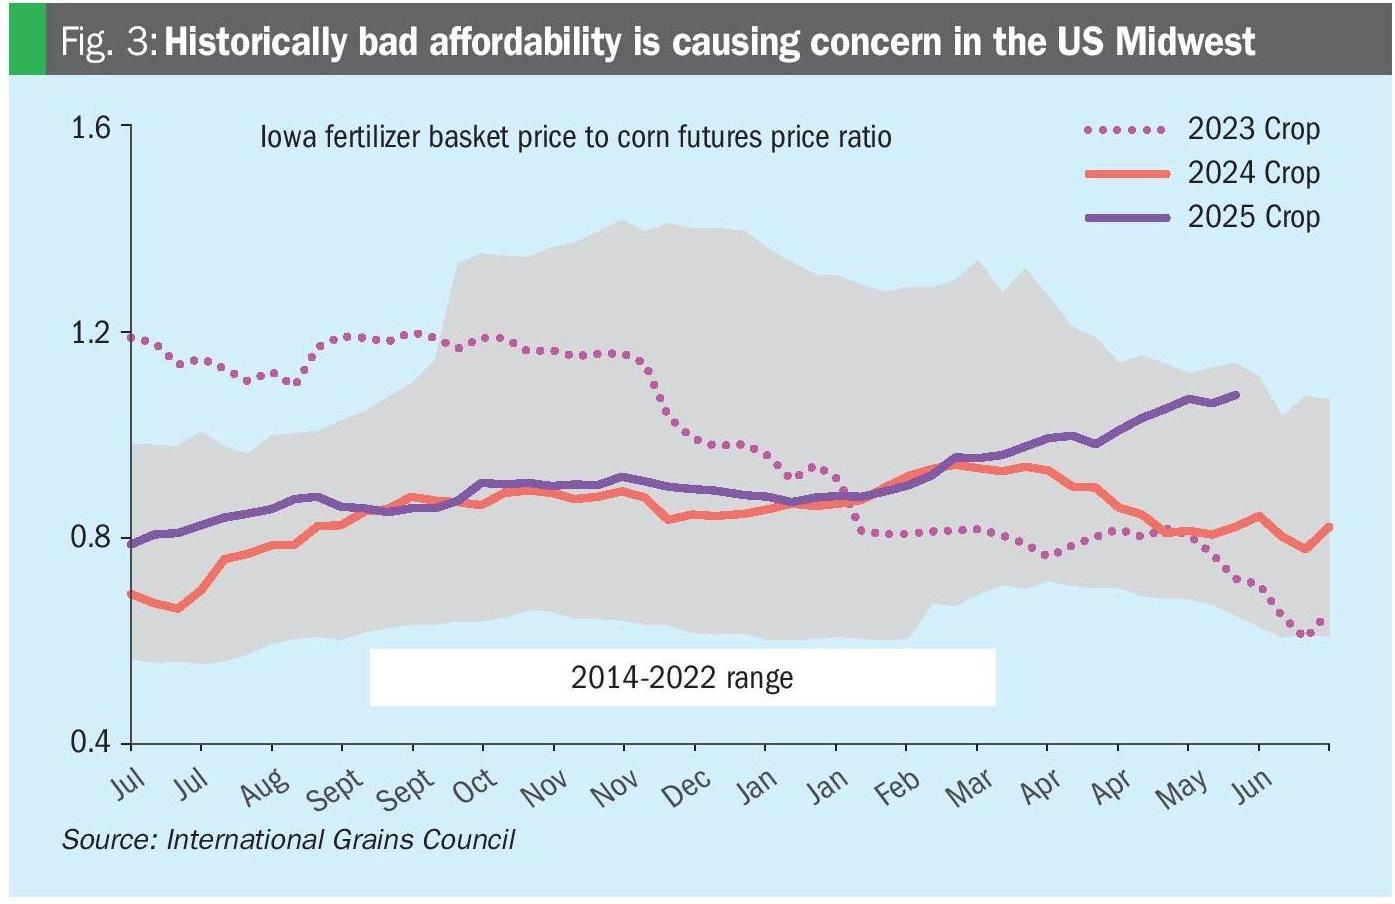
Urea ammonium nitrate (UAN) affordability in the US Midwest is actually the worst on record for this point in the year, since tracking began in the 2004/05 season. Affordability of the other major fertilizer commodities is also poor: diammonium phosphate (DAP) has hit its worst level since 2008, while urea is at its worst since 2012. Potash affordability remains the lone bright spot, as its affordability in the Midwest is slightly better than the 15-year average.
In addition to affordability concerns, US growers will have to contend with increased corn carryout, with USDA’s May WASDE estimate suggesting this year’s harvest will rise 9.8 million year-on-year to 45.7 million tonnes for 2025. If realised, USDA’s forecast would be 1.1 million tonnes above the 10-year average and the highest carryout since 2019/20. The US corn stocks-to-use ratio for 2025/26 is also forecast at 11.6 – this being above the 5-year average of 9.7 but below the 10-year average of 12.2.
Consequently, the size of the 2026 US corn crop is expected to decline year-on-year, based on the carry build from 2025 and lower US corn pricing.
Unsurprisingly, given the agricultural backdrop, overall US fertilizer demand is forecast to decline in 2026, with nitrogen and phosphate both seen lower, and potash higher (Figure 4).
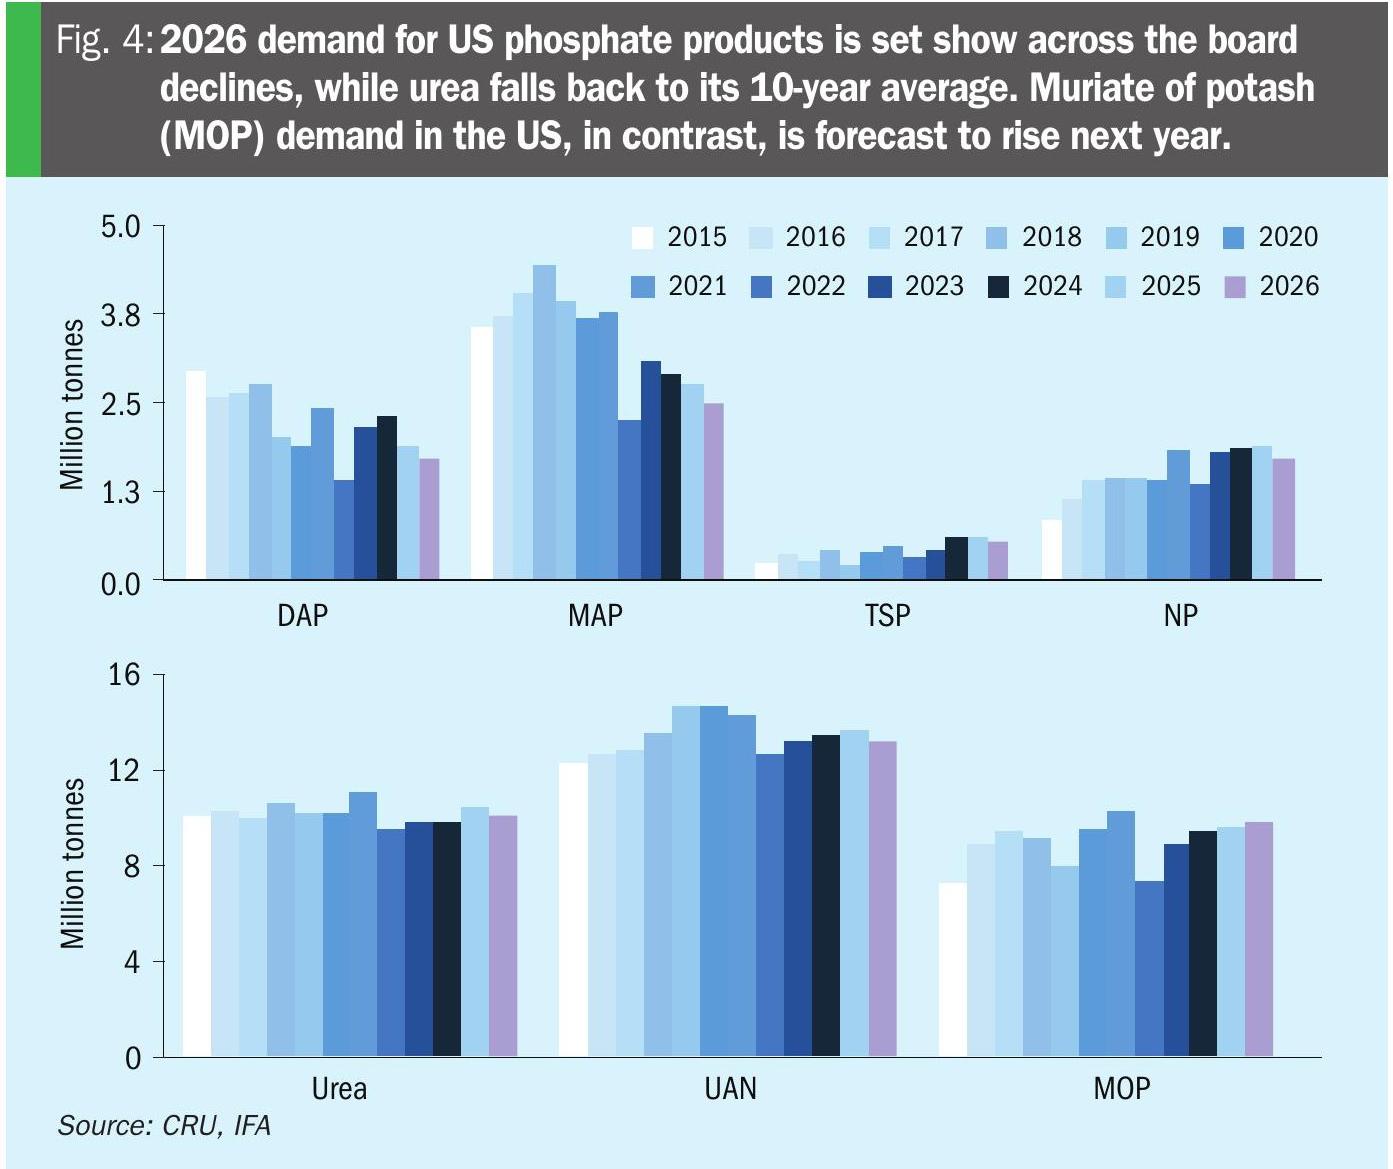
US phosphate consumption is forecast to take a hit, declining to 6.5 million tonnes in 2026 versus 7.2 million tonnes this year, due to affordability and availability concerns. Within this nutrient group, alternative products like triple superphosphate (TSP) – which is unexposed to nitrogen pricing – and NP (which provides additional nutrients) will continue to gain market share, despite the overall year-on-year consumption decline.
US nitrogen demand, while less sensitive to affordability, is also seen lower, predominantly due to the expectation of lower corn and higher soybean acreage in 2026. Consumption is forecast at 10.4 million tonnes for urea and 13.5 million tonnes for UAN, both slightly below their long-term averages.
US potash demand, meanwhile, is expected to rise year-on-year from 9.7 million tonnes to 10 million tonnes in 2026, given that products remain relatively affordable and available, especially compared to phosphates. Additionally, an acreage switch from corn to soybeans in 2026 will still support demand, unlike the situation seen for nitrogen.
Record 2025 soybean crop underpins Brazilian demand
Brazil is expected to produce a record soybean harvest of 168.3 million tonnes in 2025, according to the National Supply Company’s latest grain harvest survey released on 15th May. Further support comes from the country’s corn output, with cumulative production across all three corn crops forecast at 126.9 million tonnes.
Both corn and soybean are set to benefit from year-on-year increases in area and yield, per Conab’s report. CRU anticipates a 3 kg/ha increase for the combined fertilizer nutrient application rate, which brings the rate to 211 kg/ha for 2025. As a result, total nutrient consumption is forecast to reach 20.8 million tonnes, an increase of 2.9% from 2024.
Soil health, expanding production, outweigh 2026 affordability concerns
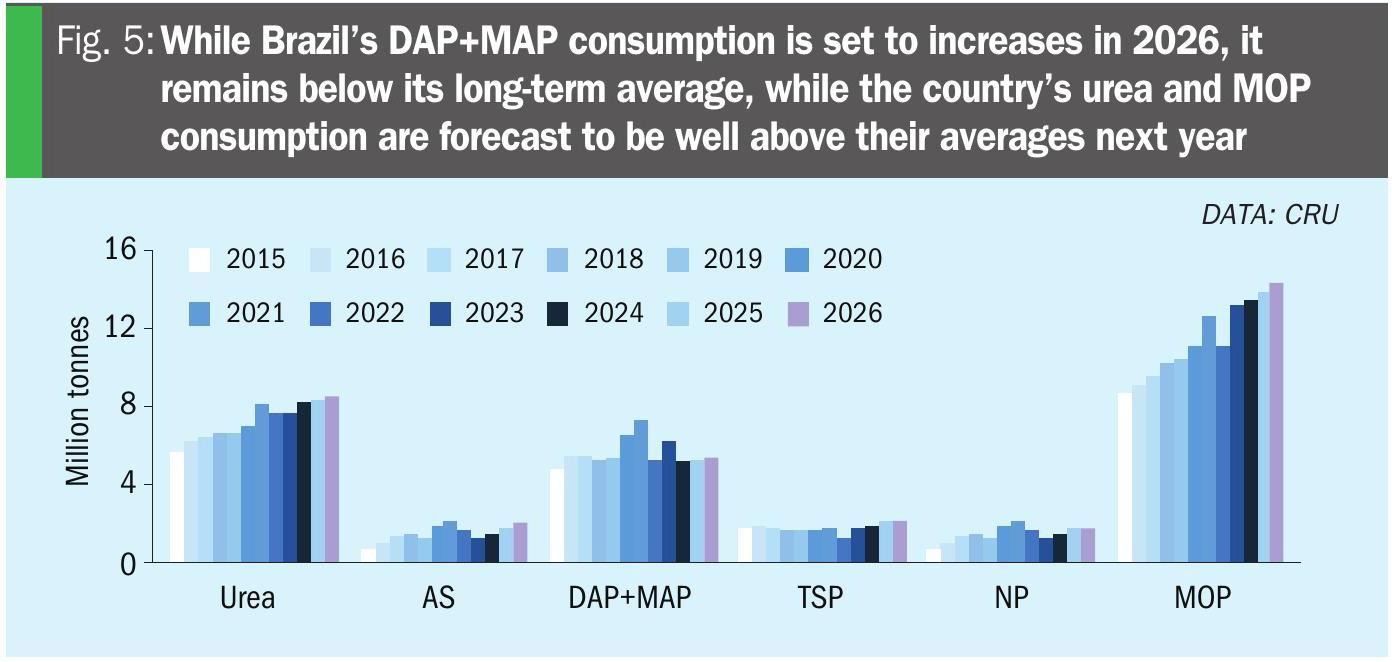
Brazil’s fertilizer consumption is expected to remain robust in 2026 (Figure 5), as demand for the country’s grain exports continues to be strong and its agricultural growing area expands.
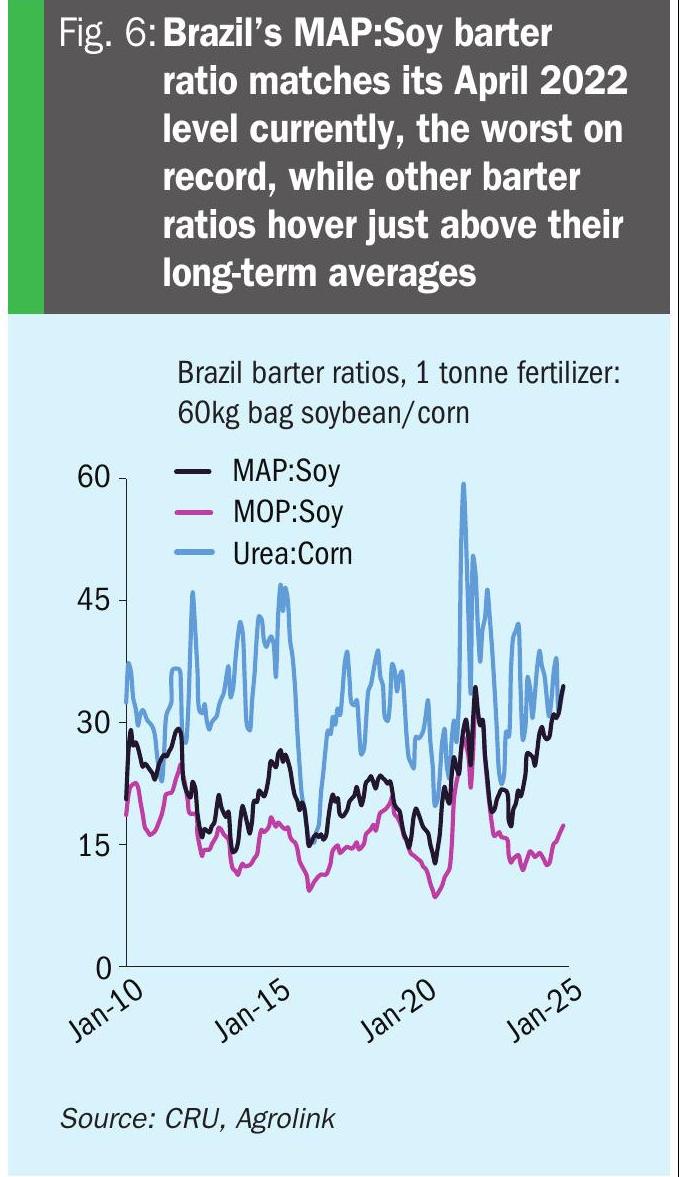
Barter ratios are a useful affordability metric for Brazil – being a comparison of fertilizer pricing to the price of the crop they are mainly applied to (Figure 6). Barter ratios for MOP and urea are middling, with both sitting just above their long-term averages. Monoammonium phosphate (MAP) affordability, in contrast, is historically bad as its barter ratio currently matches the level last seen in April 2022, the worst level since tracking began in 2010. While MAP affordability is a cause for concern, the country’s soil deficiency requires P applications to remain heavy and an essential, particularly on newly cultivated land.
While DAP+MAP demand is seen 0.1 million tonnes higher year-on-year at 5.4 million tonnes, this is still below the 5.8 million tonne 10-year average for both. Brazilian growers are much more sensitive and reactive to prices than their North American counterparts, leading to product substitution. Consequently, the market share of TSP, ammonium sulphate (AS), and NP are all expected to continue increasing. TSP offers growers a phosphate source without the added nitrogen cost, while AS and NP bring additional nutrients to the table.
Brazil’s TSP and NP consumption are forecast at 2.2 million tonnes and 1.8 million tonnes in 2026, respectively, while AS is seen at 2.1 million tonnes. Brazil’s growing corn crop will help support continued growth in urea consumption, which is seen rising 0.3 million tonnes year-on-year to 8.6 million tonnes in 2026. Apparent potash consumption is forecast to grow from 13.7 million tonnes in 2025 to 14.5 million tonnes next year.
China’s 2025 demand declines as overapplication corrected
China has been attempting to correct fertilizer overapplication since introducing its 2015 ‘zero growth by 2020’ plan – to little avail initially. Under recent food security initiatives, however, the country has ramped up efforts to limit overapplication by focusing on better growing practices. Consequently, China’s total fertilizer application rate this year is forecast to decline by 1 kg/ha to 238 kg/ha. Nitrogen and phosphate applications are expected to fall by 2 kg/ha and 1 kg/ha year-on-year, respectively, with potash alone seeing an application rate gain of 2 kg/ha in 2025.
China’s 2025 harvested area is forecast marginally higher at 185.9 million hectares compared to 185.7 million hectares last year. Overall fertilizer demand in China is therefore set to decline by 0.4% to 44.2 million tonnes – down from 44.4 million tonnes in 2024 – due to this minimal additional area and lower application levels.
The country’s 2025 corn and soybean imports look like being flat and lower, respectively, compared to last year, according to the 12th May China Agricultural Supply and Demand Estimates report, pointing to less reliance on the global market. A slightly larger increase in the domestic harvested area is expected in 2026, with 0.6% growth to 186.9 million hectares forecast.
Attractive MOP prices have resulted in elevated deliveries to China, with these expected to rise from 18 million tonnes this year to 18.9 million tonnes in 2026. China doubled its strategic MOP reserve last year, as part of moves to keep domestic pricing down under the country’s food security initiative. Urea demand is forecast at 67.3 million tonnes in 2026, almost 1% lower year-on-year, as applications get more efficient. China’s DAP+MAP+TSP demand, meanwhile, is seen at 22.7 million tonne, 4% lower year on year.
Key takeaways for 2026
Market participants should expect an uneven demand landscape in 2026 with regional forecasts at variance with the overall global picture.
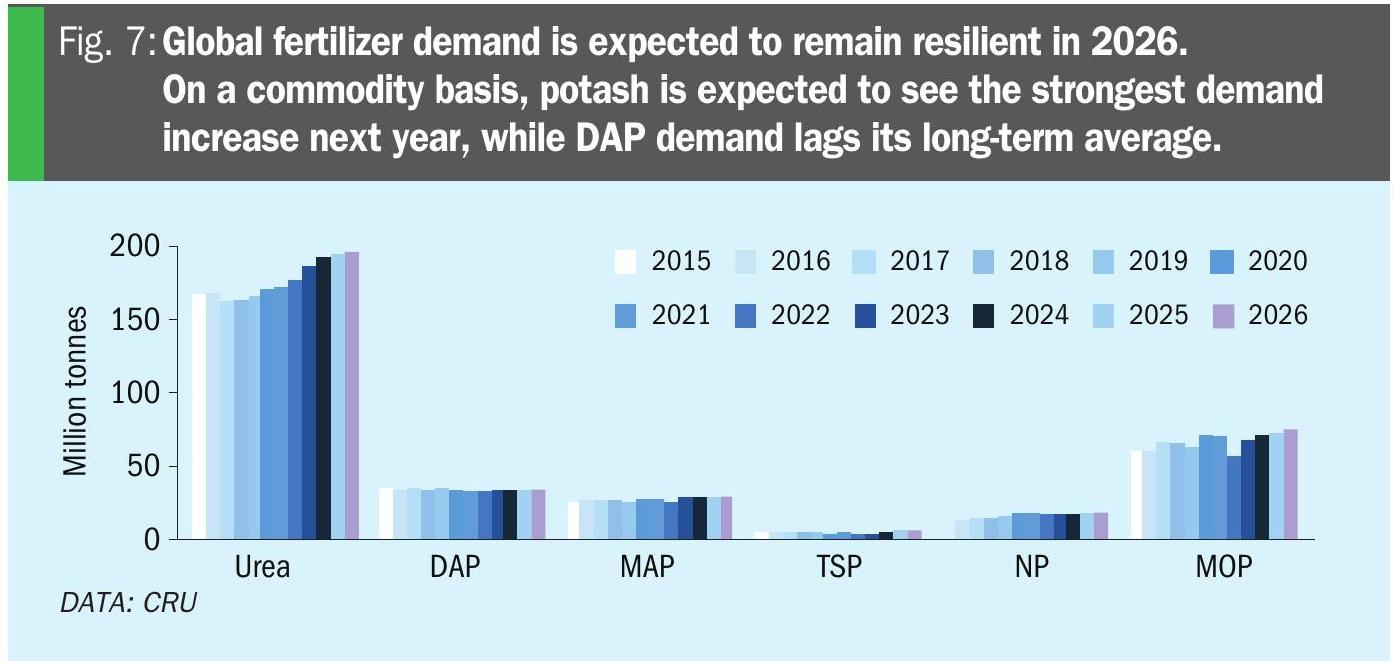
High phosphate prices look set to remain a fixture in the near-term, offsetting a global crop area increase, and leading to a global demand reduction for phosphate in 2026. While global phosphate fertilizer demand is seen marginally lower at 89.2 million tonnes next year, larger pullbacks are forecast in China and the US, where demand deferral is now expected to turn to destruction. While MAP, TSP, and NP consumption all remain well above their historical averages, DAP trails its average as this product continues losing market share to other phosphate product types.
Global potash deliveries are expected to grow 3.4% to 75.7 million tonnes next year, with product relatively affordable and available across key markets. Potash consumption should also continue to benefit from the spread between potash and phosphate affordability, as this still greatly favours the former.
Global nitrogen demand is seen 0.6% higher in 2026 due to increased crop area. Lower demand is forecast in both China and the US, however, as China continues to correct its application practices and the US plants a smaller corn crop in 2026.
Affordability has been a huge talking point over the past year, and rightfully so. Despite this, however, Global fertilizer demand (Figure 7) is expected to remain resilient in 2026, with the effects of poor affordability largely isolated to specific regional markets.
About the author

Anthony Rizzo is CRU’s Senior Analyst for Fertilizer Demand and US markets
Tel: +1 724 201 8877