Nitrogen+Syngas 399 Jan-Feb 2026
26 January 2026
The market for natural gas
NATURAL GAS
The market for natural gas
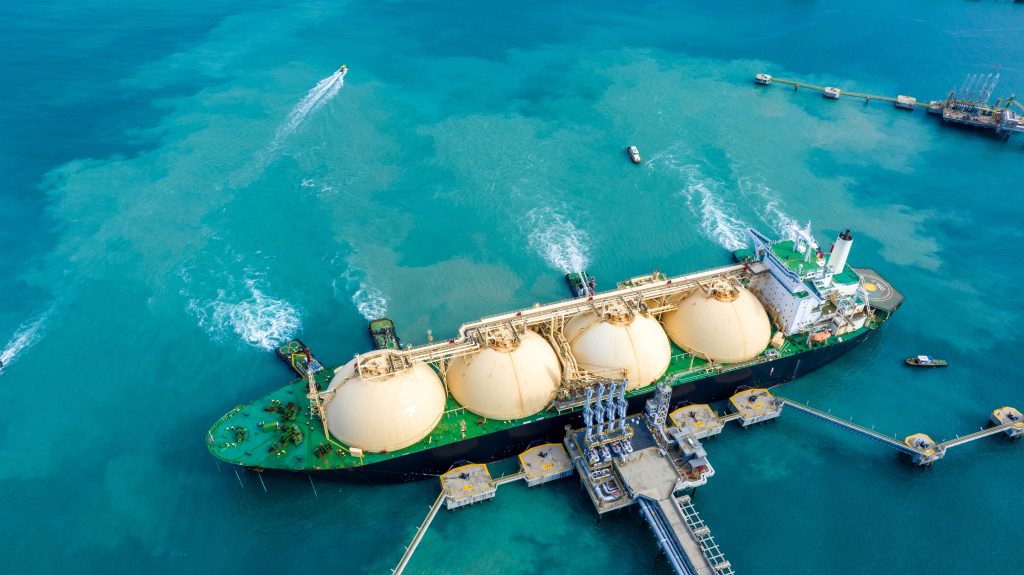
Gas consumption is rebounding in Europe as prices stabilise at lower levels, while the LNG market continues to see large capacity additions.
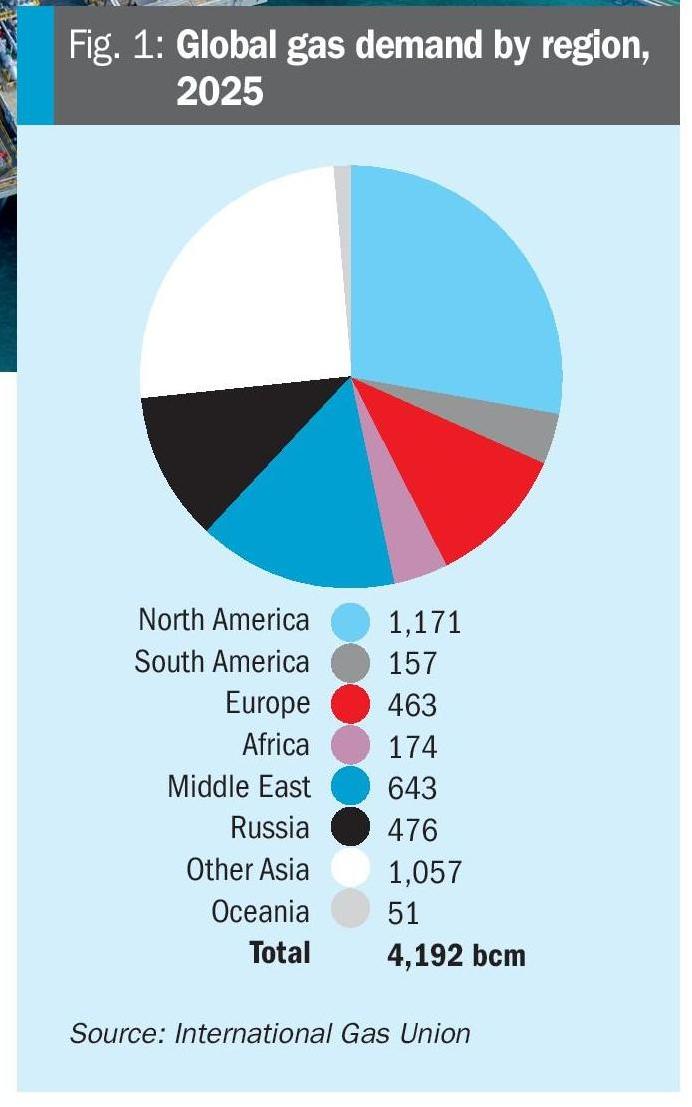
Global gas consumption rose to roughly 4,120 bcm in 2024, an increase of about 78 bcm (1.9%) year-on-year. Growth was driven by power sector demand (notably linked to extreme summer heat), industrial rebound and regional heating/cooling needs. Rising electricity demand for AI/data centres is also playing a role. This growth continued into 2025, but the pattern diverged regionally: Europe and North America showed stronger demand in the first half of the year, including a surge in European LNG imports, while China and some Asian buyers curtailed spot procurement amid high prices and abundant domestic supply. Overall, 2025 demand is likely to have risen by about another 1.9% over 2024. Natural gas continues to play a role in balancing fluctuating demand from renewable electricity.
On the supply side, LNG trade expanded again, reaching roughly 555 bcm in 2024 – the eleventh consecutive year of growth. This reinforced LNG’s role as the flexible backbone of cross-border gas supply. However, declining upstream deliverability in some producing basins, maintenance schedules, and sanctions-related disruptions have limited output in some regions. That dynamic, alongside new LNG supply, is already changing interregional flows: pipeline trade to Europe has fallen dramatically compared with the pre-2022 era, while LNG has provided an alternative source of supply and seasonal flexibility.
Regional highlights
Asia Pacific remains the primary demand driver to 2030. China and India together account for a large portion of incremental demand in the base case – around 40% – supported by industrial growth, some coal-to-gas switching, powersector needs and expanding distribution networks. Price sensitivity in the emerging markets in Asia means that lower LNG prices could unlock additional demand, but only if import infrastructure is in place.
Europe’s natural gas supply increased by an estimated 6.5% (19 bcm) in Q1-Q3 2025. The strong increase in LNG imports, together with higher non-Norwegian gas production, offset the declines recorded in piped gas imports. LNG imports rose by 28% (or almost 28 bcm) and reached an all-time high of 127 bcm due to stronger domestic demand, together with lower piped gas imports and higher storage injections, meaning that the share of LNG in Europe’s gas supply rose from 35% in Q1-Q3 2024 to 42% in Q1-Q3 2025. The US increased its LNG deliveries to Europe by 60% and alone accounted for almost all incremental LNG supply to Europe during this period. Russia’s piped gas supplies to the European Union fell by 45% (or 10 bcm) in Q1-Q3 2025 amid the halt of gas transit via Ukraine, although Russian exports to Turkey rose by more than 20% (or almost 2.5 bcm). The share of Russian piped gas in Europe’s gas demand is estimated at below 10%.
In North America, supply continues to grow, mainly from shale and associated gas, which is facilitating LNG export expansion. US production underpins global LNG liquidity and has been a central determinant of marginal global supply cost. US gas production is estimated to have grown by 3.3% in the first nine months of 2025, underpinned by rising LNG requirements and a stronger gas price environment. Despite a downward trajectory since the start of the year, Henry Hub prices averaged $3.11/MMBtu in 2Q and 3Q 2025, about 50% above the same period the previous year. This helped reverse a period of production decline in the higher-cost Haynesville Basin, while Appalachian output recovered to and surpassed pre-2024 levels. US domestic consumption is set to remain largely flat during 2026, with demand from new liquefaction projects set to drive production growth. Despite the scale of liquefaction capacity additions, the US market is expected to remain well supplied, with dry gas production growing by 3% in 2025 and about 2% in 2026, reaching new record highs in both years.
LNG
LNG supply growth is one of the major stories of global gas markets. There is around 300 bcm/year of nameplate supply capacity scheduled to come onstream between 2025 and 2030, with the US and Qatar accounting for the bulk of new capacity. In 2025 the US liquefaction sector saw a record run of final investment decisions, including Louisiana LNG, Corpus Christi expansions, CP2, Plaquemines and Port Arthur phase 2, reflecting policy support and developer confidence. Other projects in Canada, Mexico and selected African projects (e.g., Nigeria train additions, Congo FLNG) add further volumes, diversifying sources beyond the traditional AustraliaQatarMalaysia suppliers. Some pre-FID projects in Mozambique and elsewhere remain uncertain.
Not all of this capacity will be available straight away; nameplate capacity does not equal delivered tonnage in the early years, and typical liquefaction projects can take months or even years to reach steady output, and occasionally underperform due to commissioning or maintenance. The IEA and industry trackers assume progressive ramp rates and lower early-cycle utilisation. In addition, some older exporters, such as Australia, where gas fields are in natural decline, and facilities in Alaska, as well as those dependent on pipeline gas, are suffering feedgas constraints, maintenance outages or geopolitical restrictions. Combined, these effects can reduce available supply by multiple tens of bcm versus static nameplate additions. New LNG will displace some pipeline trade flows, most notably to Europe, as much as it will add net global supply. However, even if 250 bcm/year is a more realistic figure for the actual supply increase, this supply will continue to reshape global gas markets.
The growth in LNG export optionality and the associated expansion of the global fleet will lower the marginal cost of serving distant buyers relative to the late2010s era of tighter cross-basin flows. But the construction lead times of liquefaction plants and the sensitivity of investment decisions to price signals mean the industry faces a potential risk of underinvestment if prices fall and remain low.
Demand
Set against this, global gas demand is projected to increase by about 9% out to 2030, or around 380 bcm/year, most of this concentrated in the Asia Pacific region, including China, India, and ‘emerging Asia’. China and India together account for a large share of the base case increase, and South/Southeast Asia offers significant upside in a price-responsive scenario. Industrial fuel switching, gas power growth where renewables and nuclear cannot immediately cover rising electricity needs, and sectoral demand for shipping bunker fuel, heavy road transport, data centre power via gas-backed generation, etc., all support robust demand growth.
Conversely, Europe is likely to see a modest structural decline in domestic demand due to increasing efficiency of use and progressive electrification of some sectors, as well as increased supply from renewable energy, but LNG will remain critical for security and seasonal balancing; North American demand is projected to grow more slowly, but sees continued industrial and data centre power demand.
The International Energy Agency’s high case scenario shows that if hub/spot prices converge toward the short-run marginal cost of competitive US LNG, price-sensitive Asian markets could unlock additional demand of ~65 bcm by 2030 versus the base case.
Prices and market structure
The gas industry continues to shift away from long term contracts towards gas-to-gas indexation and hub-based pricing, as well as some hybrid and shorter-term contracts. LNG contracting in particular is evolving, with more destination-flexible cargoes, and new market entrants are increasing options for buyers. As noted above, there are some variables here; if incremental LNG supply outpaces basecase demand (due to slow infrastructure rollout or a weaker macroeconomic situation), downward pressure on spot prices could persist, discouraging new FIDs toward the end of the decade and sowing the seeds of a post2030 tightening. Conversely, a price convergence closer to US short-run marginal costs would encourage price-responsive demand in Asia and limit shut-ins.
Market liquidity will rise, due to a larger spot market and increased tradable volumes, but the transition creates transitional risks: stranded upstream or liquefaction investment if low prices persist, and short-term volatility tied to weather, storage cycles and geopolitical shocks.
Infrastructure
The LNG shipping order book and floating storage, regasification and use capacity will expand; shipping will be a binding constraint if fleet renewal and shipyard capacity lag cargo growth into the late 2020s. Investment in regasification terminals and distribution infrastructure in emerging markets is crucial to absorb incremental LNG supply.
Gas storage continues to be a systemic buffer. Europe’s storage targets and prudential policies influence seasonal spreads and flows; Asia’s limited storage capacity raises sensitivity to supply disruptions and seasonal shocks.
Decarbonisation
Carbon capture, usage and storage (CCUS) is moving from demonstration to deployment in selected value chains such as cement, chemicals, and hydrogen production. For new gas projects and LNG exporters, embedding low-emission options (e.g., CCUS at liquefaction plants) is becoming a competitive differentiator in some buyer markets. Elsewhere, low-emission gaseous fuels such as biomethane, low-emission hydrogen, and even low-carbon syngas-derived methane (‘e-methane’) are continuing to scale rapidly, albeit from a small base. These will remain a small portion of total gaseous energy through 2030, but could be important in niches and premium markets and provide strategic low-carbon options for particular buyers. However, the commercial rollout of CCUS and low-emission gases depends on policy instruments, whether direct support, carbon pricing, mandates, low-carbon product markets, or offtake frameworks, in order to close the price gap and unlock financing at scale.
Looking forward
The most probable outcome for 2030 is a larger, more liquid global LNG market with significant US and Qatari supply, diversified pricing, including broader hub indexation, and continued regional divergence in demand growth, with Asia driving the upside. The market should absorb much of the incremental supply in the base case, but not without periods of volatility and pockets of oversupply that pressure spot prices. CCUS and low-emission gases will be significantly larger than today but still limited relative to total gas volumes; they will, however, play increasingly visible roles in buyer differentiation and policy discussions.