Sulphur 422 Jan-Feb 2026
28 January 2026
China’s ammonium sulphate boom
AMMONIUM SULPHATE
China’s ammonium sulphate boom
The Chinese ammonium sulphate industry continues to see rapid growth, with exports rising to record levels, against increasing demand coming from Brazil and India.
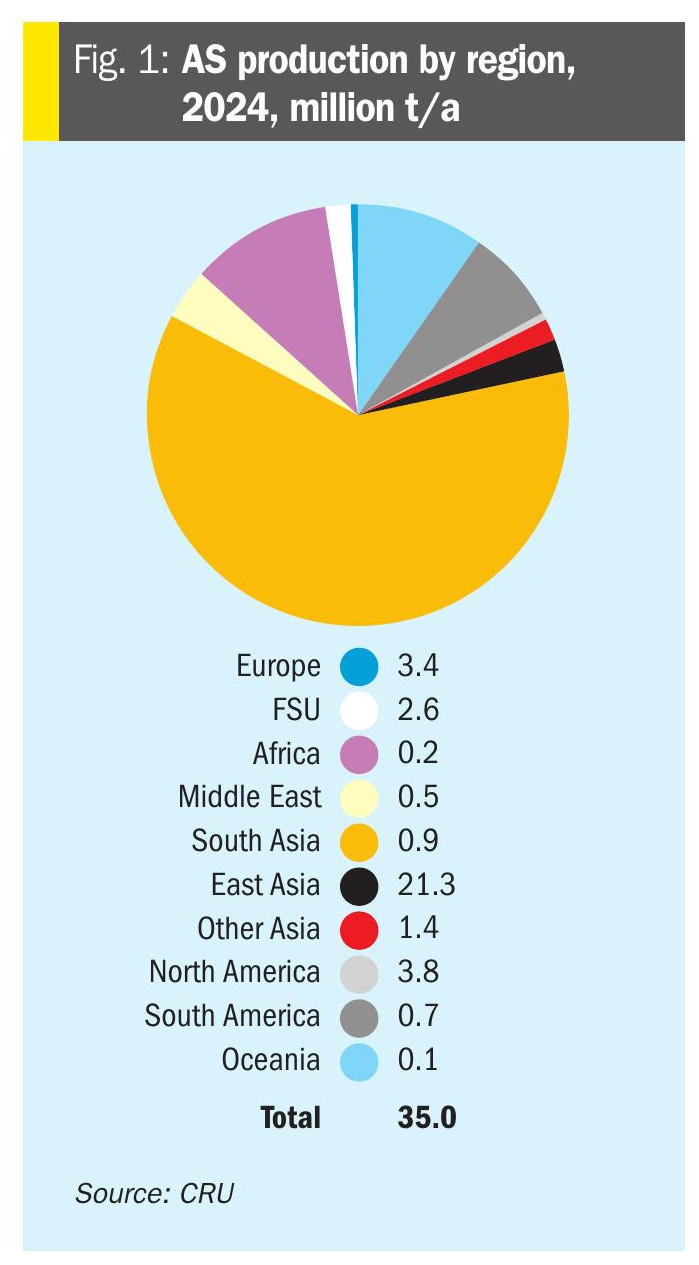
Ammonium sulphate is still the largest sulphur fertilizer by volume. Global ammonium sulphate production was 35.0 million t/a in 2024, with the 2025 figure expected to reach 35.8 million t/a. Figure 1 shows the geographical distribution of capacity. As can be seen, most is in East Asia, and 95% of that figure is represented by China, where there is a great deal of involuntary production as a by-product of caprolactam manufacture for nylon fibres, methylmethacrylate (MMA), acrylonitrile, methionine production etc.
Production
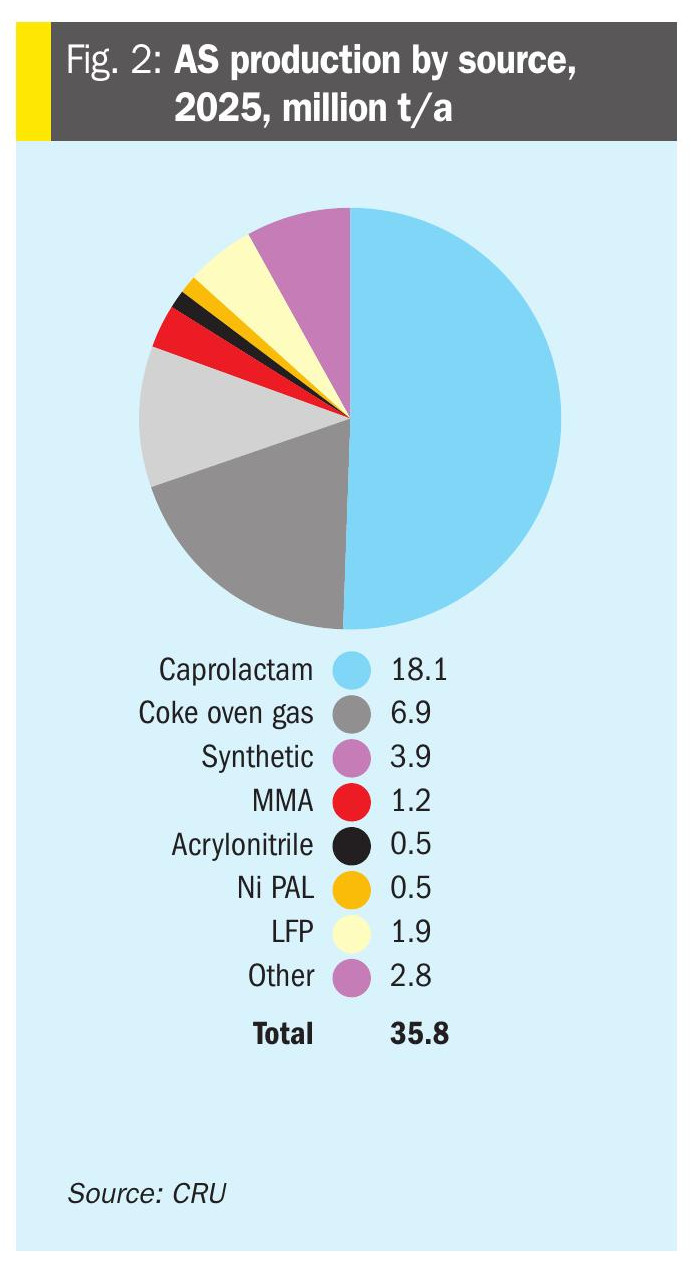
Chemical sources of ammonium sulphate are shown in Figure 2. About half of all ammonium sulphate production comes as a by-product of caprolactam production, but that figure is much higher in China, where the rapid increase in artificial fibre production has led to a major increase in caprolactam production there, and concomitant demand for sulphuric acid. Other major involuntary sources of AS production are ammonia scrubbing of coke oven gas, and as a by-product of lithium iron phosphate production, the latter again increasingly important in China due to the rapidly expanding battery manufacturing industry for electric vehicles. Indeed, China is the single largest and fastest-growing source of traded AS. Capacity expanded rapidly over the last decade as caprolactam and lithium iron phosphate (LFP) industries increased coproduct AS output. Chinese AS production reached record levels in 2024 (20.1 million t/a), and exports continued to break records into 2025.
Overall, about 70% of AS capacity is based on by-products from other production, and in China this figure is 83%. It is also 90% in Europe and 73% in North America. However, in the Middle East, Africa and South America, the opposite is true, and on-purpose production predominates, between 75% of production (in South America) to 95% (in the Middle East).
Byproduct routes drive most of the growth. Caprolactam-derived AS and LFP-related production account for the majority of incremental capacity additions over the period 2024–2026. Voluntary, ammonia-based routes picked up in regions such as Russia, where new projects and restarts increased granular and synthetic capacity through 2025.
Consumption
AS consumption is virtually all (95%) as a fertilizer, with its sulphur content becoming increasingly relevant. Consumption is more widely distributed than production, with the strongest demand in Asia (though not China, which uses relatively small quantities) and Latin America – particularly Brazil. There are some exports from Europe, but low operating rates for caprolactam production there mean that there are also imports, but the AS trade is dominated by China, which is by far the largest exporter. Because much of AS production is involuntary, a striking amount of AS is traded across borders; 21.8 million t/a in 2024. Chinese exports represented 17.1 million t/a in that year, or more than 75% of all traded AS.
Sulphur deficiency in soils remains a structural demand driver for sulphur-containing fertilizers. Areas with pronounced sulphur deficits – South Asia, East Asia, and parts of Africa – are long-term addressable markets for AS. The global sulphur deficit has been gradually reducing but remains elevated, supporting incremental AS uptake where agronomic and price conditions allow.
Recent developments
During 2025 the global ammonium sulphate (AS) market was characterised by a dominant and growing supply surge from China, ongoing structural shifts in demand – notably large-scale substitution toward AS in Brazil and gradual uptake in India – and a weakening AS premium versus urea as nitrogen product prices evolve. China’s exports rose strongly in 2024 and continued through 2025, reaching 19.0 million t/a, putting pressure on prices and forcing traditional exporters and regional producers to reposition their sales strategies. However, this has been complicated in recent months by port congestion in Brazil and other logistical issues, and temporary supply disruptions in sulphur and ammonia markets that supported input costs, and prebuying ahead of regulatory measures in Europe (CBAM).
Compacted granules and improved agglomerated/crystalline products from China have allowed Chinese exports to compete in markets that historically preferred granular products (for blending and mechanised application). This shift reduced the granular premium in importing markets like Brazil and Europe.
Brazil
Brazil was the single most important demand story in 2025, representing over 1/3 of all global imports. Robust substitution of urea and ammonium nitrate by AS (especially granular AS used in bulk blends) and expansion of farmed areas pushed Brazilian AS demand sharply higher: imports into Brazil hit record levels and granular demand dominated the import profile. Shipments to Brazil were up 11|% during 2025.
Brazil’s agricultural economics – corn/cotton/soy/pasture rotations and the value placed on S for yield/soil conditioning – combined with favourable AS pricing, created a sustained surge in imports, almost entirely sourced from China in 2024–25. In Brazil, the AS premium to urea declined to historically low levels in 2025 Q2–Q3; in some snapshots, AS traded at a discount to urea for the first time on record, which catalysed substitution and import demand. The result is Brazil’s AS consumption rising substantially, from 1.9 million t/a in 2017 to 6.0 million t/a in 2024, with forecasts pointing towards 9.7 million t/a of imports by 2029.
India
India showed substantial import growth and rising acceptance of AS in 2025. Imports have risen markedly, from 140,000 t/a in 2020 to 600,000 t/a in 2025, and the updated Nutrient-Based Subsidy (NBS) policy for 2025–26 incorporated domestic and imported AS – a significant policy signal that can underpin longerterm demand growth. Nevertheless, AS still represented a small share of India’s total nitrogen demand in 2025, and structural change will be gradual.
Elsewhere
Southeast Asian demand in 2025 experienced affordability pressure. Price relationships versus key crops (rice, palm oil) matter: falling rice prices in Thailand and Vietnam and higher AS prices reduced affordability for farmers, slowing purchases in 2025 H1. Indonesia and Malaysia (palm oil) remained more supportive, but overall regional imports from China increased their share at the expense of Far East suppliers.
Europe imported more AS in 2025, partly driven by buyers frontrunning CBAM implementation and sourcing cheap Chinese volumes. Domestic caprolactambased production in Western Europe remained subdued because of low caprolactam operating rates and structural chemical industry weakness.
Price developments
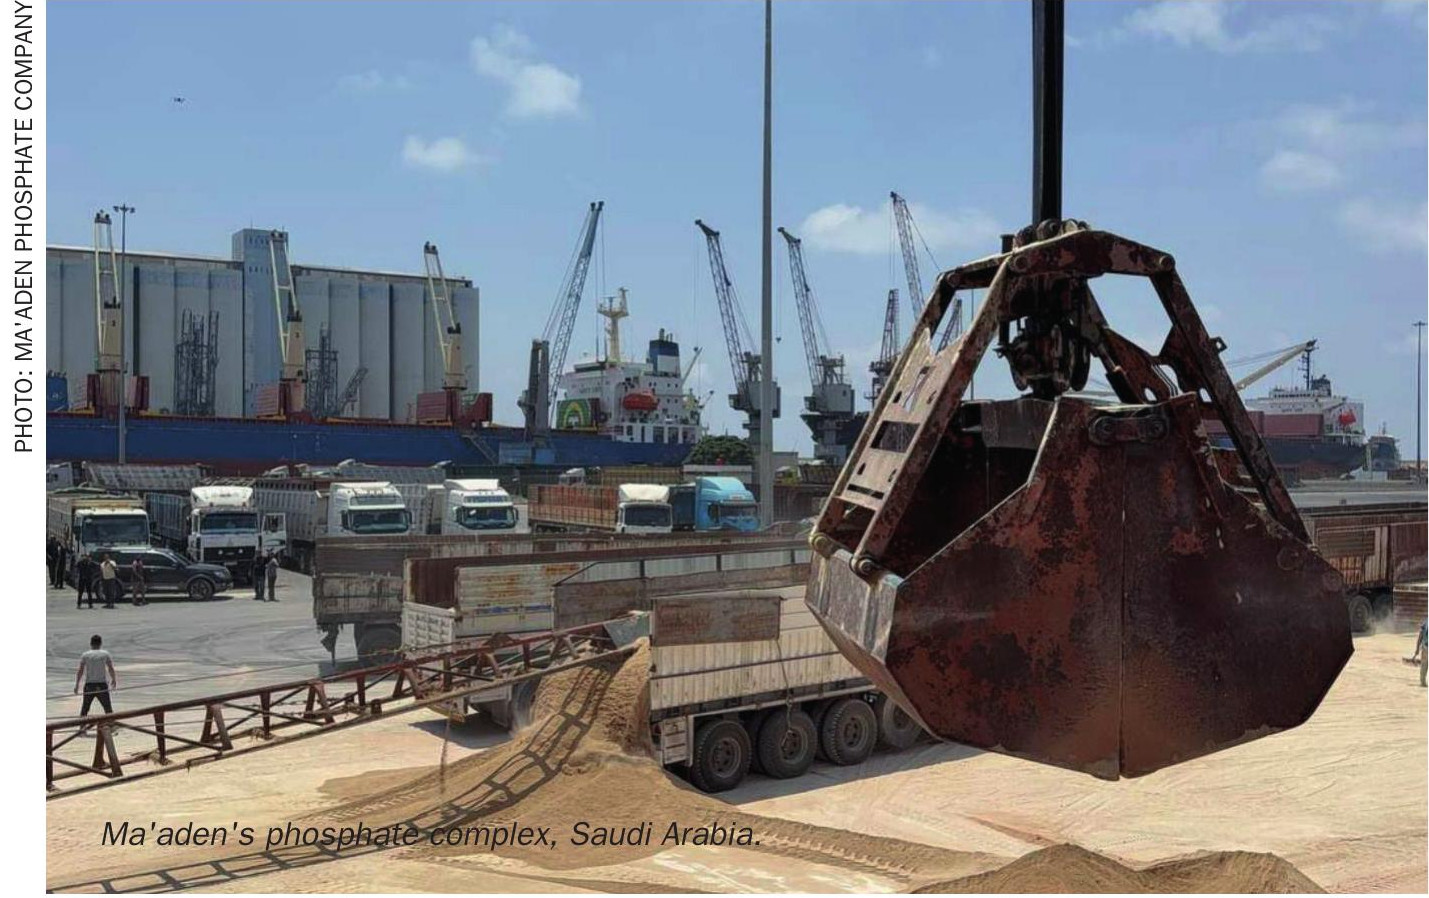
AS price trends during 2025 were shaped by a tug of war: abundant Chinese supply and logistics pushed delivered prices lower in many markets, while input cost shocks, including episodic sulphur and ammonia tightness such as downtime at Ma’aden in Saudi Arabia temporarily supported production costs in some regions. However, these cost pressures did not fully offset the market effect of rising global byproduct supplies.
Looking ahead
China remains the dominant producer and exporter; domestic consumption weakened as urea became more attractive domestically in 2025, and AS was exempt from export inspection which allowed volumes to move abroad freely. Provincial export hubs (e.g., Fujian, Hubei) contributed heavily to the export surge. Forecasts show continued export growth through 2026–29 absent major policy changes.
Conversely, Brazil was the major importer and the primary demand engine in 2025; granular adoption and substitution trends are reshaping the nitrogen import basket. China supplied essentially all incremental Brazilian needs in 2024–25, forcing legacy suppliers (Europe, US) to seek alternative markets.
Uncertainties for 2026 are whether new urea capacity and urea price moves and potential trade policy responses, including tariffs, inspection rules, and in Europe CBAM implementation, will alter farmer economics and restore stronger premiums to AS or accelerate further substitution and import growth.
Acid consumption
Overall, the world consumed around 18.6 million t/a of sulphuric acid in 2025 to make ammonium sulphate, or about 6% of all acid demand. China represented just over half of that acid demand (9.4 million t/a). Sulphuric acid use for AS production is expected to grow to 20.8 million t/a in 2029, with China representing around 55% of incremental production, but increased production is expected in western Europe, the US, India and elsewhere.